## Diagram: Arrangement of Dotted Rectangles with Black Dots
### Overview
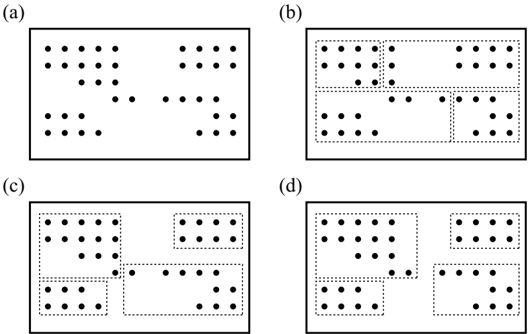
The image contains four distinct diagrams labeled (a) through (d), each depicting a rectangular area subdivided into smaller dotted rectangles. Black dots are distributed within these rectangles, with varying patterns of density and positioning. No textual labels, legends, or axis markers are present.
### Components/Axes
- **Diagram (a)**: A single large dotted rectangle containing scattered black dots. No internal subdivisions.
- **Diagram (b)**: Four smaller dotted rectangles arranged in a 2x2 grid within a larger rectangle. Dots are concentrated in specific sub-rectangles.
- **Diagram (c)**: Three dotted rectangles of varying sizes nested within a larger rectangle. Dots are grouped densely in some sub-rectangles.
- **Diagram (d)**: Four dotted rectangles with irregular spacing and sizes. Dots are distributed unevenly across sub-rectangles.
### Detailed Analysis
- **Diagram (a)**:
- Single rectangle with 25 black dots distributed unevenly.
- Dots cluster in the top-left and bottom-right corners, with sparse coverage in the center.
- **Diagram (b)**:
- Four equal-sized sub-rectangles.
- Top-left and bottom-right sub-rectangles contain 12 dots each; top-right and bottom-left have 6 dots each.
- **Diagram (c)**:
- Three sub-rectangles: two large (top and bottom) and one small (center-right).
- Top sub-rectangle holds 18 dots, bottom has 10, and the small center-right contains 4.
- **Diagram (d)**:
- Four sub-rectangles with varying sizes.
- Top-left (10 dots), top-right (8 dots), bottom-left (6 dots), and bottom-right (4 dots).
### Key Observations
- **Hierarchical Segmentation**: Diagrams (b), (c), and (d) suggest hierarchical data partitioning, with sub-rectangles representing subsets of data.
- **Density Variance**: Diagram (a) shows the most dispersed distribution, while (b) and (c) exhibit concentrated clusters.
- **Irregularity**: Diagram (d) lacks symmetry, with sub-rectangles overlapping and dots unevenly spaced.
### Interpretation
The diagrams likely represent a visualization of data segmentation or hierarchical clustering. The absence of labels or legends limits definitive interpretation, but the patterns suggest:
1. **Data Partitioning**: Sub-rectangles may represent categories or clusters (e.g., (b) could model quadrant-based data).
2. **Density as a Metric**: Dot concentration might indicate frequency or importance (e.g., (c) highlights a dominant top sub-rectangle).
3. **Anomalies**: Diagram (d)’s irregular layout could signify outliers or unstructured data.
No numerical values or explicit relationships are provided, so conclusions remain speculative. The diagrams emphasize spatial organization over quantitative analysis.