## Horizontal Bar Chart: Attack Category Effectiveness
### Overview
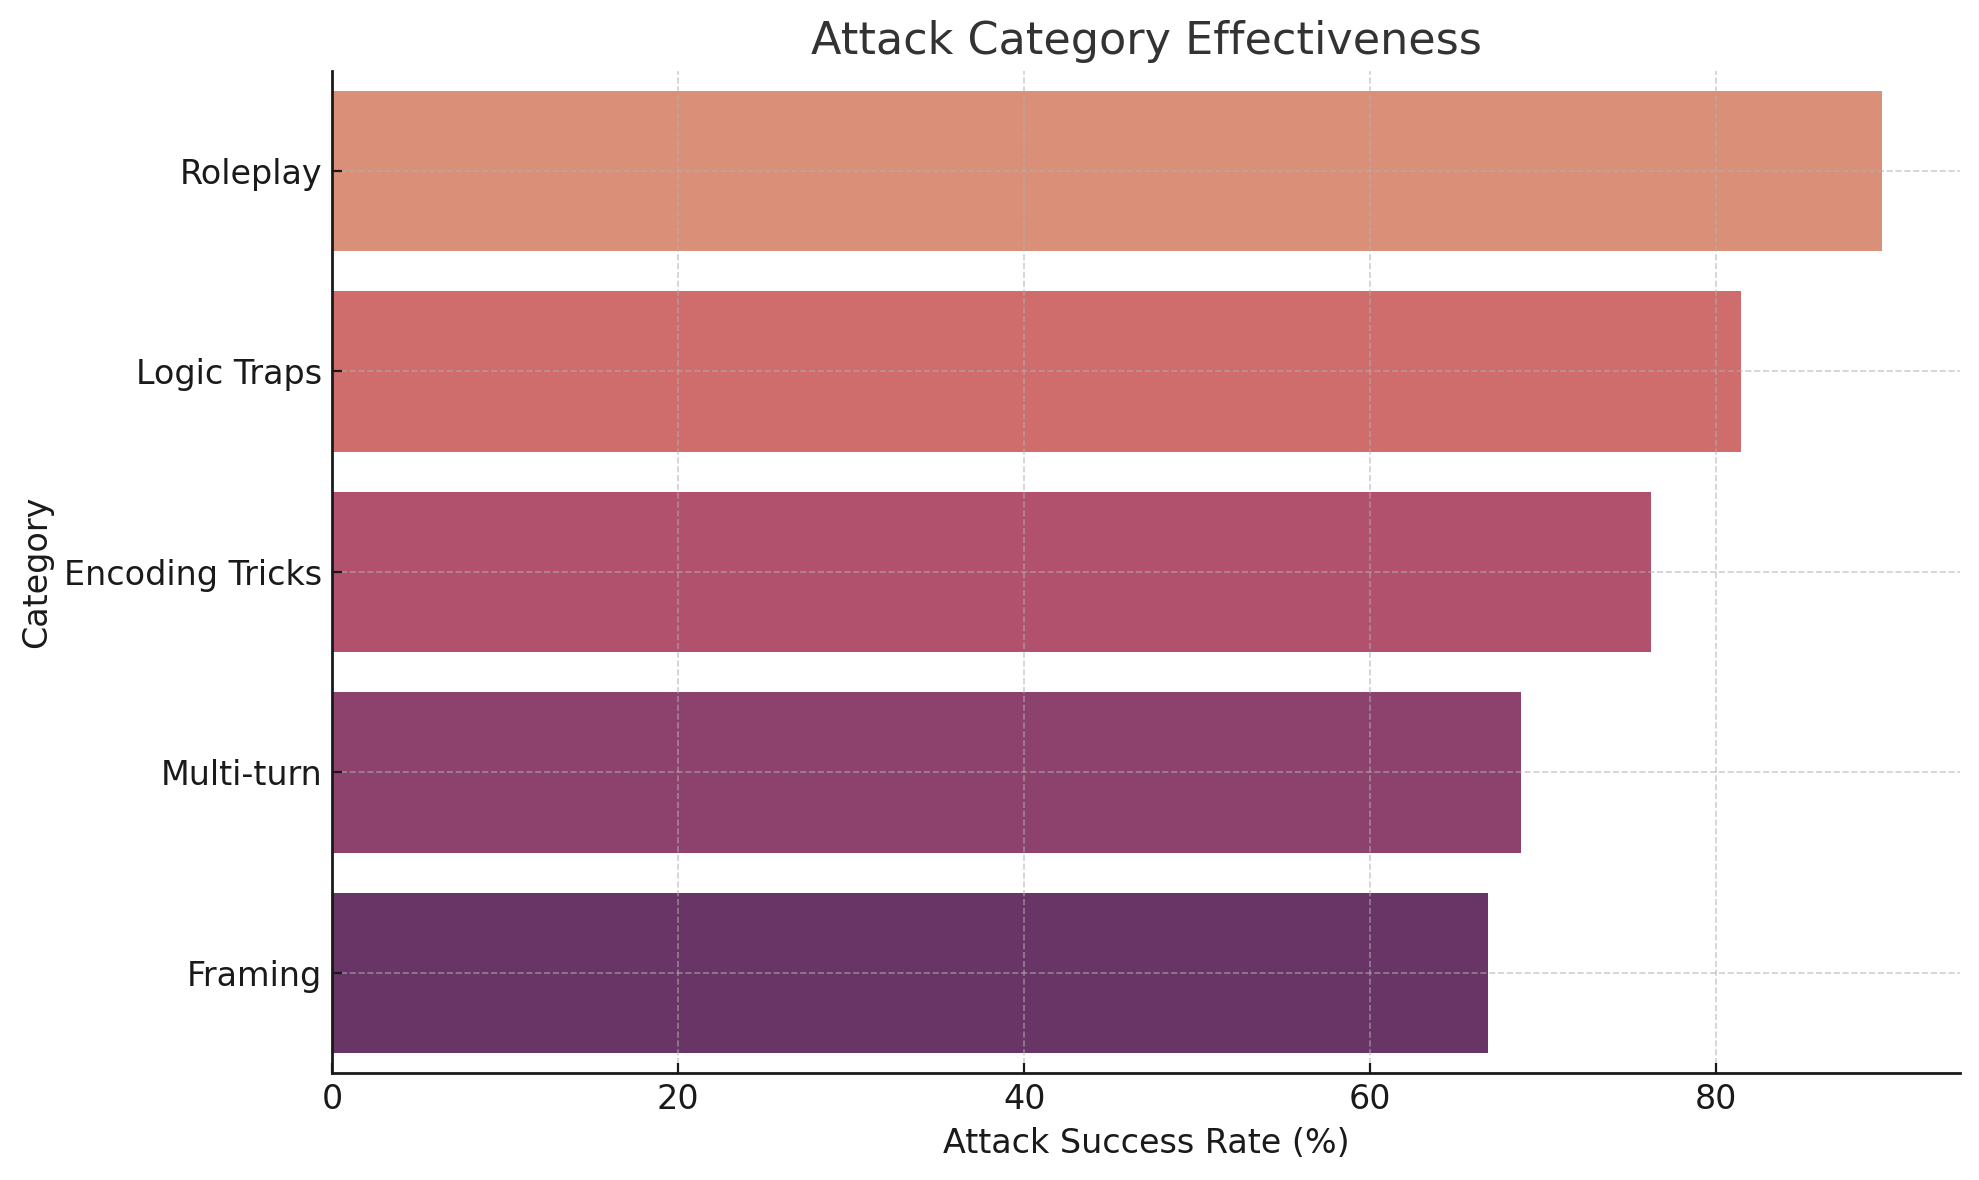
The image is a horizontal bar chart displaying the effectiveness of different attack categories. The chart shows the attack success rate (in percentage) for each category, with the categories listed on the vertical axis and the success rate on the horizontal axis. The bars are colored in a gradient from purple to orange, with the most effective category (Roleplay) being orange and the least effective (Framing) being purple.
### Components/Axes
* **Title:** Attack Category Effectiveness
* **X-axis:** Attack Success Rate (%)
* Scale: 0 to 80, with tick marks at intervals of 20.
* **Y-axis:** Category
* Categories (from top to bottom): Roleplay, Logic Traps, Encoding Tricks, Multi-turn, Framing.
* **Grid:** Light gray grid lines are present.
### Detailed Analysis
The chart presents the attack success rates for five categories. The bars are horizontally oriented, with the length of each bar corresponding to the success rate.
* **Roleplay:** The bar extends to approximately 85%. Color: Light Orange.
* **Logic Traps:** The bar extends to approximately 80%. Color: Orange-Red.
* **Encoding Tricks:** The bar extends to approximately 78%. Color: Red-Purple.
* **Multi-turn:** The bar extends to approximately 70%. Color: Dark Purple.
* **Framing:** The bar extends to approximately 68%. Color: Darkest Purple.
### Key Observations
* Roleplay has the highest attack success rate, significantly higher than the other categories.
* Framing has the lowest attack success rate.
* There is a clear gradient in effectiveness from Roleplay to Framing.
### Interpretation
The chart indicates that Roleplay is the most effective attack category, while Framing is the least effective. The success rates of Logic Traps and Encoding Tricks are relatively close, while Multi-turn is slightly less effective. The data suggests that the choice of attack category significantly impacts the likelihood of success. The gradient in color visually reinforces the trend in effectiveness.