\n
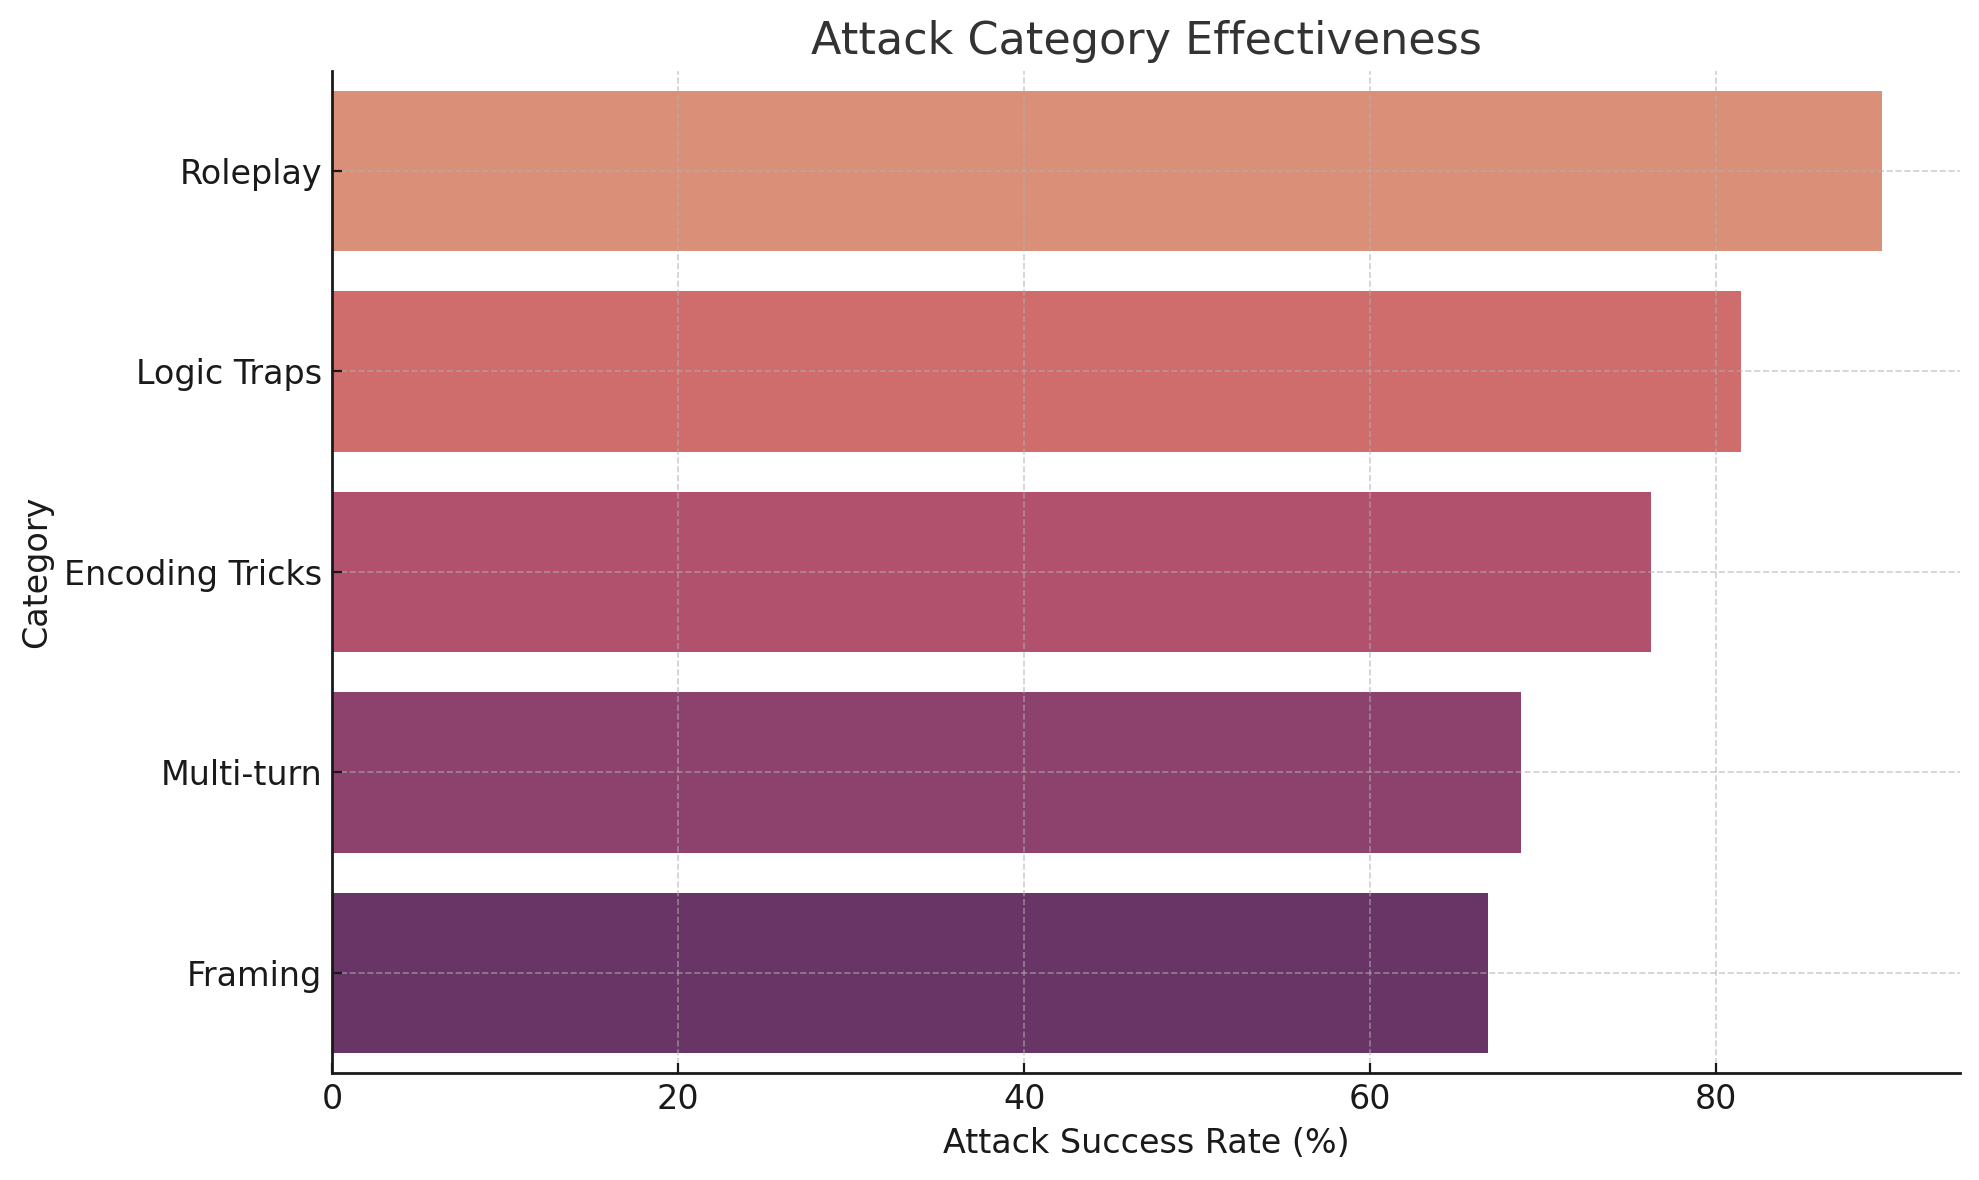
## Horizontal Bar Chart: Attack Category Effectiveness
### Overview
The image presents a horizontal bar chart illustrating the effectiveness of different attack categories, measured by their success rate. The chart compares five attack categories: Roleplay, Logic Traps, Encoding Tricks, Multi-turn, and Framing. The x-axis represents the Attack Success Rate in percentage, ranging from 0 to 80. The y-axis lists the attack categories.
### Components/Axes
* **Title:** "Attack Category Effectiveness" (centered at the top)
* **X-axis Label:** "Attack Success Rate (%)" (bottom-center)
* **Y-axis Label:** "Category" (left-center)
* **Categories:** Roleplay, Logic Traps, Encoding Tricks, Multi-turn, Framing
* **Color Scheme:** A gradient of reddish-purple hues, with lighter shades representing lower success rates and darker shades representing higher success rates.
### Detailed Analysis
The bars are arranged vertically, with Roleplay at the top and Framing at the bottom.
* **Roleplay:** The bar for Roleplay extends to approximately 78% on the x-axis. The color is a light reddish-orange.
* **Logic Traps:** The bar for Logic Traps extends to approximately 74% on the x-axis. The color is a medium reddish-orange.
* **Encoding Tricks:** The bar for Encoding Tricks extends to approximately 70% on the x-axis. The color is a medium reddish-purple.
* **Multi-turn:** The bar for Multi-turn extends to approximately 64% on the x-axis. The color is a darker reddish-purple.
* **Framing:** The bar for Framing extends to approximately 60% on the x-axis. The color is the darkest reddish-purple.
The bars generally decrease in length as you move down the y-axis, indicating a decreasing trend in attack success rate.
### Key Observations
* Roleplay has the highest attack success rate, significantly higher than the other categories.
* Framing has the lowest attack success rate.
* The success rates are relatively close for Roleplay, Logic Traps, and Encoding Tricks.
* There is a noticeable drop in success rate between Encoding Tricks and Multi-turn.
### Interpretation
The chart suggests that Roleplay is the most effective attack category, while Framing is the least effective. This could indicate that Roleplay is easier to execute successfully, or that defenses against Framing are more robust. The relatively high success rates of Roleplay, Logic Traps, and Encoding Tricks suggest these are viable attack strategies. The lower success rates of Multi-turn and Framing may indicate that these attacks are more difficult to pull off, or that targets are more aware of them.
The data implies a hierarchy of attack effectiveness, with Roleplay being the most potent and Framing the weakest. This information could be valuable for security professionals in prioritizing defenses or for attackers in selecting the most promising attack vectors. The visual trend of decreasing success rates as you move down the chart is clear and supports the quantitative data. The color gradient effectively reinforces this trend, making it easy to quickly identify the most and least effective attack categories.