## Heatmap: Global Wind Speed Ratio
### Overview
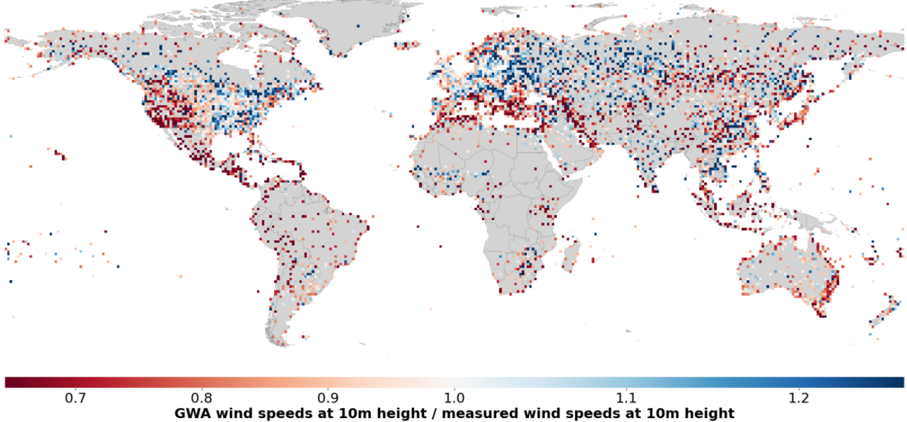
The image is a world map heatmap visualizing the ratio of GWA (Global Wind Atlas) wind speeds at 10m height to measured wind speeds at 10m height. The color of each pixel on the map represents this ratio, with red indicating lower GWA wind speeds compared to measured speeds, and blue indicating higher GWA wind speeds. Gray areas represent landmasses.
### Components/Axes
* **Map:** World map showing continents and countries.
* **Color Scale (Legend):** Located at the bottom of the image.
* **Red:** Represents a ratio of 0.7.
* **Orange-Red:** Represents a ratio of 0.8.
* **Light Orange:** Represents a ratio of 0.9.
* **White:** Represents a ratio of 1.0.
* **Light Blue:** Represents a ratio of 1.1.
* **Dark Blue:** Represents a ratio of 1.2.
* **Label:** "GWA wind speeds at 10m height / measured wind speeds at 10m height" is placed below the color scale.
### Detailed Analysis
* **North America:** The western part of North America, particularly the US, shows a prevalence of red and orange-red pixels, indicating that GWA wind speeds are lower than measured wind speeds in this region. The eastern part of North America shows a mix of colors, with some areas showing higher GWA wind speeds (blue pixels).
* **South America:** The majority of South America shows a mix of colors, with a slight tendency towards red and orange-red, indicating that GWA wind speeds are generally lower than measured wind speeds.
* **Europe:** Europe shows a mix of colors, with some areas showing higher GWA wind speeds (blue pixels), particularly in the northern regions, and other areas showing lower GWA wind speeds (red pixels), particularly in the southern regions.
* **Asia:** Asia shows a significant variation in wind speed ratios. Eastern Russia shows predominantly blue pixels, indicating higher GWA wind speeds. Central Asia and parts of China show a mix of red and blue.
* **Africa:** Africa shows a mix of colors, with some areas showing higher GWA wind speeds (blue pixels), particularly in the northern and southern regions, and other areas showing lower GWA wind speeds (red pixels), particularly in the central regions.
* **Australia:** Australia shows a mix of colors, with a tendency towards red and orange-red, indicating that GWA wind speeds are generally lower than measured wind speeds.
### Key Observations
* There is significant regional variation in the ratio of GWA wind speeds to measured wind speeds.
* Some regions, like western North America, consistently show lower GWA wind speeds compared to measured speeds.
* Other regions, like eastern Russia, consistently show higher GWA wind speeds.
* Many regions show a mix of higher and lower GWA wind speeds, suggesting that the accuracy of GWA wind speed estimates may vary depending on location.
### Interpretation
The heatmap suggests that the Global Wind Atlas (GWA) model has varying accuracy in predicting wind speeds across the globe. The ratio of GWA wind speeds to measured wind speeds provides insight into where the model tends to overestimate or underestimate wind speeds. Regions with predominantly red pixels indicate areas where the GWA model underestimates wind speeds, potentially due to factors not captured by the model, such as local terrain or atmospheric conditions. Conversely, regions with predominantly blue pixels indicate areas where the GWA model overestimates wind speeds. The variations in accuracy highlight the importance of validating wind speed models with local measurements to ensure reliable wind resource assessments. The data suggests that the GWA model may need further refinement to improve its accuracy in certain regions.