## Chart: maj@K Accuracy vs. K for Different Models
### Overview
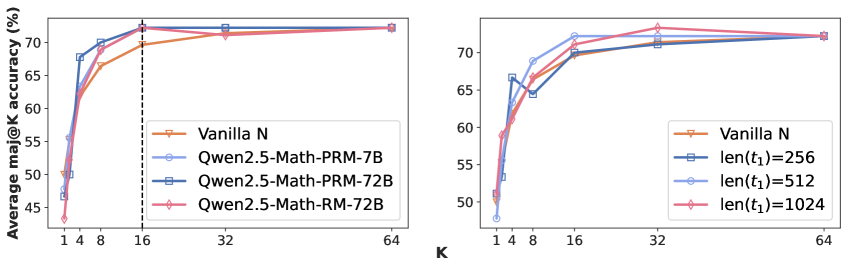
The image presents two line charts comparing the Average maj@K accuracy of different models across varying values of K. The charts appear to evaluate model performance based on the top K predictions. The left chart compares "Vanilla N" to three variations of "Qwen2.5-Math-PRM" and "Qwen2.5-Math-RM". The right chart compares "Vanilla N" to models with different context lengths (len(t1) = 256, 512, 1024).
### Components/Axes
Both charts share the following components:
* **X-axis:** Labeled "K", with values ranging from 1 to 64. The scale is logarithmic, with markers at 1, 4, 8, 16, 32, and 64.
* **Y-axis:** Labeled "Average maj@K accuracy (%)", with a scale ranging from 48% to 72%.
* **Legends:** Located in the top-right corner of each chart, identifying the different data series by color.
The left chart's legend includes:
* Vanilla N (Orange)
* Qwen2.5-Math-PRM-7B (Blue)
* Qwen2.5-Math-PRM-72B (Purple)
* Qwen2.5-Math-RM-72B (Pink)
The right chart's legend includes:
* Vanilla N (Orange)
* len(t1)=256 (Blue)
* len(t1)=512 (Light Blue)
* len(t1)=1024 (Pink)
### Detailed Analysis or Content Details
**Left Chart:**
* **Vanilla N:** Starts at approximately 48% at K=1, rises to around 68% at K=8, plateaus around 71% from K=16 to K=64.
* **Qwen2.5-Math-PRM-7B:** Starts at approximately 52% at K=1, rises sharply to around 68% at K=8, and plateaus around 71% from K=16 to K=64.
* **Qwen2.5-Math-PRM-72B:** Starts at approximately 52% at K=1, rises sharply to around 70% at K=8, and plateaus around 72% from K=16 to K=64.
* **Qwen2.5-Math-RM-72B:** Starts at approximately 52% at K=1, rises sharply to around 70% at K=8, and plateaus around 72% from K=16 to K=64.
* A vertical dashed line is present at K=8.
**Right Chart:**
* **Vanilla N:** Starts at approximately 48% at K=1, rises to around 68% at K=8, plateaus around 71% from K=16 to K=64.
* **len(t1)=256:** Starts at approximately 54% at K=1, rises sharply to around 68% at K=8, and plateaus around 71% from K=16 to K=64.
* **len(t1)=512:** Starts at approximately 54% at K=1, rises sharply to around 70% at K=8, and plateaus around 72% from K=16 to K=64.
* **len(t1)=1024:** Starts at approximately 54% at K=1, rises sharply to around 70% at K=8, and plateaus around 72% from K=16 to K=64.
### Key Observations
* In both charts, accuracy generally increases with K up to a point (around K=8-16), after which it plateaus.
* In the left chart, Qwen2.5-Math-PRM-72B and Qwen2.5-Math-RM-72B consistently outperform Qwen2.5-Math-PRM-7B. All three Qwen models outperform Vanilla N at higher K values.
* In the right chart, increasing the context length (len(t1)) generally improves accuracy, with len(t1)=1024 performing the best.
* The vertical dashed line at K=8 in the left chart may indicate a point of significant performance change or a threshold for evaluation.
### Interpretation
The data suggests that increasing model size (from 7B to 72B parameters in the left chart) and context length (in the right chart) improves the Average maj@K accuracy, particularly for smaller values of K. The plateauing of accuracy at higher K values indicates that beyond a certain point, increasing K does not significantly improve performance. The vertical line at K=8 in the left chart could represent a point where the models have converged to their maximum achievable accuracy.
The consistent performance of the larger Qwen models (72B) suggests that model capacity is a crucial factor in achieving high accuracy. Similarly, the improvement in accuracy with longer context lengths indicates that providing more information to the model can enhance its ability to make accurate predictions. The "Vanilla N" model serves as a baseline, and the other models demonstrate the benefits of specific architectural choices (PRM, RM) and increased context length. The charts provide a quantitative comparison of these different approaches, allowing for informed decisions about model selection and optimization.