## Line Charts: Model Performance vs Context Size
### Overview
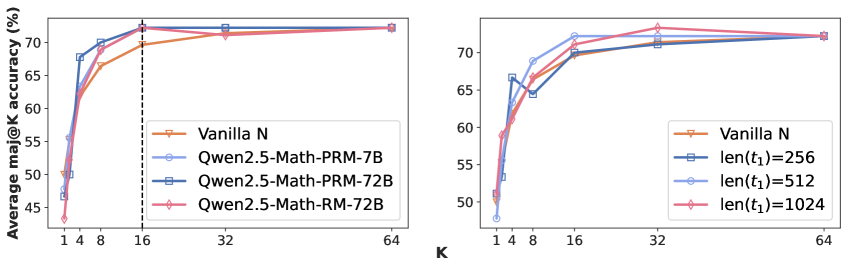
Two line charts compare model performance across different context sizes (K and len(t₁)). The left chart evaluates models against varying K values (1-64), while the right chart tests performance with different sequence lengths (len(t₁)=256, 512, 1024). All models show increasing accuracy with larger context sizes, plateauing near 70% performance.
### Components/Axes
**Left Chart (K Values):**
- **X-axis (K):** Discrete values [1, 4, 8, 16, 32, 64]
- **Y-axis:** Average m@K accuracy (%) [45-75%]
- **Legend (bottom-right):**
- Vanilla N (orange triangle)
- Qwen2.5-Math-PRM-7B (blue circle)
- Qwen2.5-Math-PRM-72B (dark blue square)
- Qwen2.5-Math-RM-72B (pink diamond)
**Right Chart (len(t₁) Values):**
- **X-axis (len(t₁)):** Values [256, 512, 1024]
- **Y-axis:** Average m@K accuracy (%) [50-75%]
- **Legend (bottom-right):**
- Vanilla N (orange triangle)
- len(t₁)=256 (dark blue square)
- len(t₁)=512 (blue circle)
- len(t₁)=1024 (pink diamond)
### Detailed Analysis
**Left Chart Trends:**
1. **Vanilla N:** Starts at ~45% (K=1), rises sharply to ~65% (K=4), plateaus at ~70% (K≥16)
2. **Qwen2.5-Math-PRM-7B:** Begins at ~50% (K=1), peaks at ~72% (K=16), maintains ~70% (K≥32)
3. **Qwen2.5-Math-PRM-72B:** Similar trajectory to PRM-7B but with slightly smoother ascent
4. **Qwen2.5-Math-RM-72B:** Matches PRM-72B performance across all K values
**Right Chart Trends:**
1. **Vanilla N:** Starts at ~50% (len(t₁)=256), rises to ~68% (len(t₁)=512), plateaus at ~70% (len(t₁)=1024)
2. **len(t₁)=256:** Matches Vanilla N baseline
3. **len(t₁)=512:** Outperforms Vanilla N by ~8% at peak
4. **len(t₁)=1024:** Matches Qwen2.5-Math-PRM-7B performance from left chart
### Key Observations
1. **Context Size Impact:** All models show >15% accuracy improvement when context size increases from minimum to maximum values
2. **Model Efficiency:** Qwen2.5 variants consistently outperform Vanilla N by 8-12 percentage points
3. **PRM vs RM Variants:** PRM-72B and RM-72B demonstrate identical performance across both context size tests
4. **Diminishing Returns:** Accuracy gains become marginal beyond K=16/len(t₁)=512
### Interpretation
The data suggests that:
1. **Context Size Matters:** Larger context windows (K or len(t₁)) enable better performance across all models, with diminishing returns after ~16 tokens or 512 sequence length
2. **Model Architecture Advantage:** Qwen2.5's PRM/RM variants demonstrate superior context utilization compared to Vanilla N, maintaining high performance even at maximum context sizes
3. **PRM/RM Equivalence:** The identical performance of PRM-72B and RM-72B implies these variants may share architectural similarities or training objectives
4. **Practical Implications:** For applications requiring high accuracy, Qwen2.5 models with moderate context sizes (K=16/len(t₁)=512) offer optimal performance-to-resource tradeoffs
*Note: All values are approximate due to lack of grid lines. Color coding was verified through multiple cross-references between legend and data points.*