# Technical Data Extraction: Recall vs. $\beta$ (%) Performance Chart
## 1. Component Isolation
* **Header:** None present.
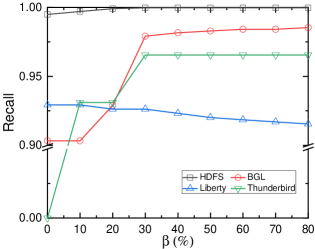
* **Main Chart Area:** A line graph plotted on a Cartesian coordinate system. The Y-axis represents "Recall" and the X-axis represents "$\beta$ (%)". The Y-axis features a scale break between 0.00 and 0.90.
* **Legend:** Located in the bottom-right quadrant of the plot area (approximate spatial grounding: [x=60-90%, y=15-30%]).
* **Footer:** None present.
---
## 2. Axis and Scale Information
* **Y-Axis (Vertical):**
* **Label:** Recall
* **Scale:** Non-linear due to a break. The lower segment is 0.00. The upper segment ranges from 0.90 to 1.00 with major tick intervals of 0.05.
* **X-Axis (Horizontal):**
* **Label:** $\beta$ (%)
* **Scale:** Linear, ranging from 0 to 80 with major tick intervals of 10.
---
## 3. Legend and Data Series Identification
The legend contains four distinct data series, each identified by a specific color and marker shape:
1. **HDFS:** Black line with open square markers ($\square$).
2. **BGL:** Red line with open circle markers ($\circ$).
3. **Liberty:** Blue line with open upward-pointing triangle markers ($\triangle$).
4. **Thunderbird:** Green line with open downward-pointing triangle markers ($\nabla$).
---
## 4. Trend Verification and Data Extraction
### Series 1: HDFS (Black, Square)
* **Trend:** This series maintains the highest performance. It starts near 0.99 at $\beta=0$ and quickly plateaus at 1.00 for all values of $\beta \ge 20$.
* **Data Points (Approximate):**
* $\beta=0$: ~0.993
* $\beta=10$: ~0.996
* $\beta=20$ to $80$: 1.00
### Series 2: BGL (Red, Circle)
* **Trend:** Starts at a baseline of ~0.903, remains flat until $\beta=10$, then shows a sharp upward slope between $\beta=10$ and $\beta=30$. It continues a very gradual upward crawl from $\beta=30$ to $\beta=80$.
* **Data Points (Approximate):**
* $\beta=0$: 0.903
* $\beta=10$: 0.903
* $\beta=20$: ~0.930
* $\beta=30$: ~0.980
* $\beta=80$: ~0.985
### Series 3: Liberty (Blue, Up-Triangle)
* **Trend:** This is the only series showing a negative correlation. It starts at ~0.93 and exhibits a steady, slight downward slope as $\beta$ increases.
* **Data Points (Approximate):**
* $\beta=0$: 0.93
* $\beta=30$: ~0.927
* $\beta=80$: ~0.915
### Series 4: Thunderbird (Green, Down-Triangle)
* **Trend:** Shows the most dramatic initial change. It starts at 0.00 when $\beta=0$, slopes sharply upward to ~0.93 at $\beta=10$, remains flat until $\beta=20$, then jumps to a plateau of ~0.965 for all values $\beta \ge 30$.
* **Data Points (Approximate):**
* $\beta=0$: 0.00
* $\beta=10$: 0.93
* $\beta=20$: 0.93
* $\beta=30$ to $80$: ~0.965
---
## 5. Reconstructed Data Table
| $\beta$ (%) | HDFS (Black $\square$) | BGL (Red $\circ$) | Liberty (Blue $\triangle$) | Thunderbird (Green $\nabla$) |
| :--- | :--- | :--- | :--- | :--- |
| **0** | ~0.993 | ~0.903 | ~0.930 | 0.000 |
| **10** | ~0.996 | ~0.903 | ~0.930 | ~0.930 |
| **20** | 1.000 | ~0.930 | ~0.928 | ~0.930 |
| **30** | 1.000 | ~0.980 | ~0.927 | ~0.965 |
| **40** | 1.000 | ~0.982 | ~0.924 | ~0.965 |
| **50** | 1.000 | ~0.983 | ~0.921 | ~0.965 |
| **60** | 1.000 | ~0.984 | ~0.919 | ~0.965 |
| **70** | 1.000 | ~0.984 | ~0.917 | ~0.965 |
| **80** | 1.000 | ~0.985 | ~0.915 | ~0.965 |
---
## 6. Summary of Findings
* **HDFS** is the most robust dataset, reaching perfect recall quickly.
* **Thunderbird** requires a minimum $\beta$ of 10% to achieve usable recall, failing completely at 0%.
* **Liberty** is the only dataset where increasing the $\beta$ parameter slightly degrades the Recall performance.
* **BGL** and **Thunderbird** both show significant performance gains when $\beta$ is increased from 20% to 30%.