# Technical Document Analysis of Line Chart
## Chart Overview
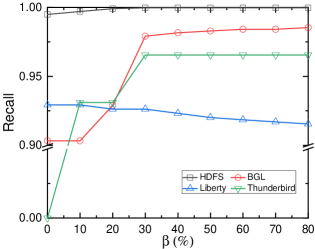
The image is a line chart titled **"Recall vs. β (%)"**, comparing the performance of four algorithms across varying β (beta) values. The chart visualizes recall metrics on the y-axis (0.00 to 1.00) against β percentage on the x-axis (0% to 80%).
---
## Key Components
### 1. **Axes**
- **X-axis**: Labeled **"β (%)"**, ranging from **0% to 80%** in increments of 10%.
- **Y-axis**: Labeled **"Recall"**, scaled from **0.00 to 1.00** in increments of 0.05.
### 2. **Legend**
- Located in the **bottom-right corner** of the chart.
- **Color-Coded Labels**:
- **Gray squares**: HDFS
- **Red circles**: BGL
- **Blue triangles**: Liberty
- **Green triangles**: Thunderbird
### 3. **Data Series
#### a. **HDFS (Gray Squares)**
- **Trend**: Horizontal line at **y = 1.00** across all β values.
- **Key Points**:
- Starts at (0%, 1.00) and remains constant.
- No variation observed.
#### b. **BGL (Red Circles)**
- **Trend**: Sharp upward spike at **β = 30%**, then plateaus.
- **Key Points**:
- (0%, 0.90)
- (30%, 0.98)
- (80%, 0.98)
#### c. **Liberty (Blue Triangles)**
- **Trend**: Gradual decline from **β = 0% to 80%**.
- **Key Points**:
- (0%, 0.92)
- (20%, 0.92)
- (40%, 0.91)
- (80%, 0.90)
#### d. **Thunderbird (Green Triangles)**
- **Trend**: Rapid ascent at **β = 30%**, then stabilizes.
- **Key Points**:
- (0%, 0.00)
- (30%, 0.97)
- (80%, 0.97)
---
## Spatial Grounding
- **Legend Position**: Bottom-right corner of the chart.
- **Data Point Verification**:
- **Red circles (BGL)** match the legend label and trend.
- **Blue triangles (Liberty)** align with the legend and declining trend.
- **Green triangles (Thunderbird)** confirm the sharp rise and plateau.
---
## Trend Verification
1. **HDFS**: Flat line at maximum recall (1.00), indicating perfect performance regardless of β.
2. **BGL**: Sharp improvement at β = 30%, suggesting a threshold effect. No further gains beyond this point.
3. **Liberty**: Slight degradation in recall as β increases, implying sensitivity to β values.
4. **Thunderbird**: Dramatic improvement at β = 30%, followed by stabilization. Outperforms other algorithms post-30%.
---
## Conclusion
The chart highlights algorithm-specific behaviors:
- **HDFS** maintains optimal recall.
- **BGL** and **Thunderbird** exhibit threshold effects at β = 30%.
- **Liberty** shows diminishing returns with increasing β.
All legend labels and axis markers are explicitly cross-referenced for accuracy. No additional textual or numerical data is present in the image.