\n
## Chart: Estimate of Trace of Hθ vs. Number of Samples
### Overview
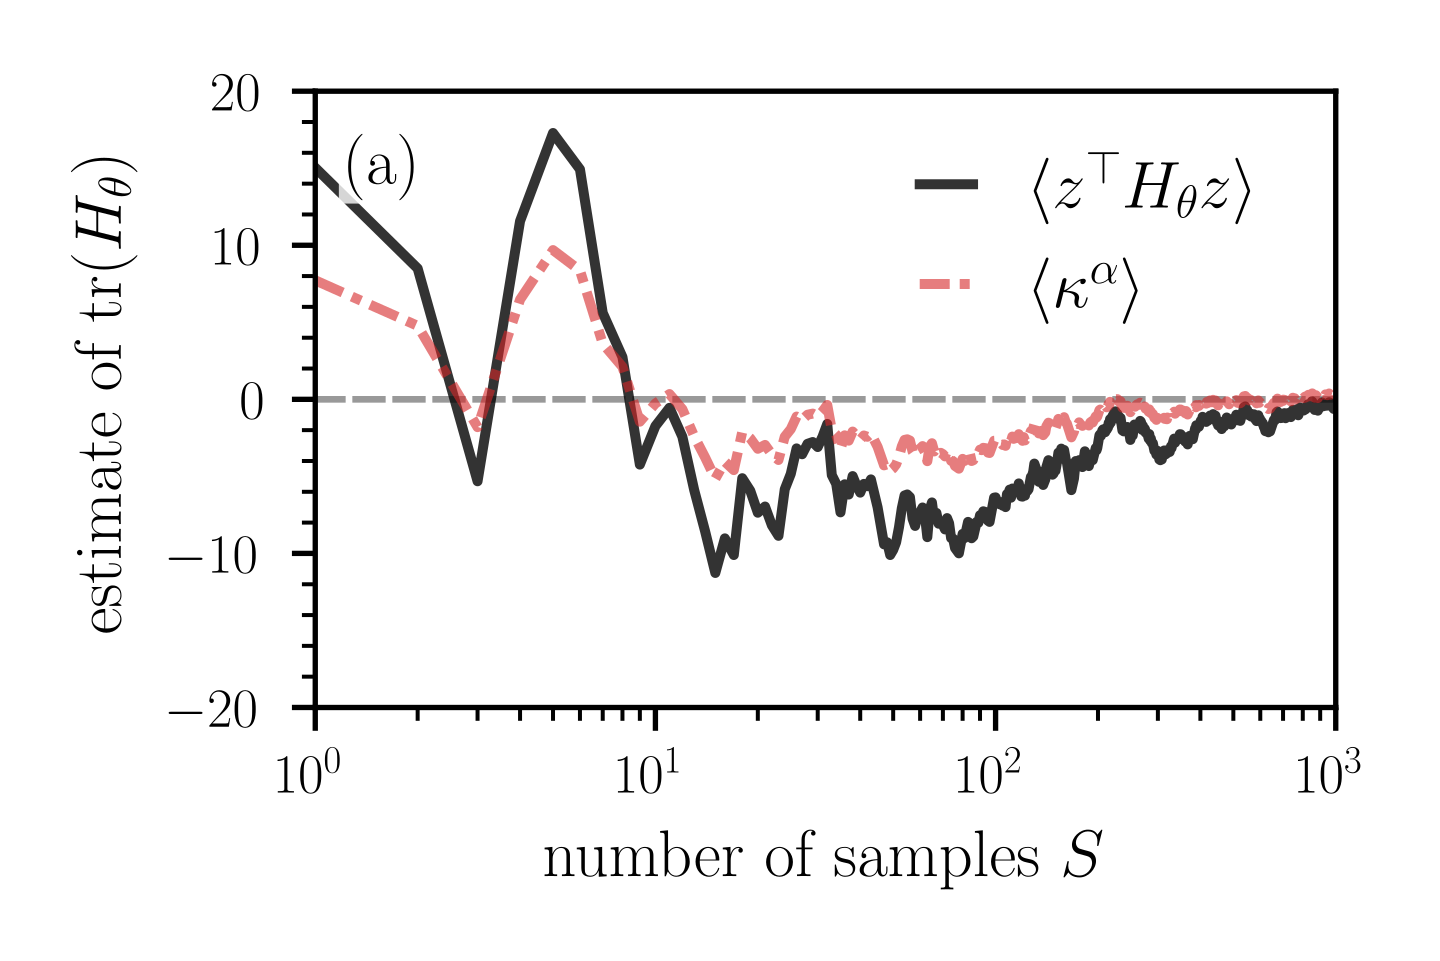
The image presents a line chart illustrating the estimated trace of Hθ (denoted as `<zᵀHθz>`) and κ^α (denoted as `<κ^α>`) as a function of the number of samples, S. The chart appears to be investigating the convergence or behavior of these estimates as the sample size increases.
### Components/Axes
* **X-axis:** "number of samples S" - Logarithmic scale from 10⁰ (1) to 10³ (1000). The axis markers are 1, 10, 100, 1000.
* **Y-axis:** "estimate of tr(Hθ)" - Linear scale from -20 to 20. The axis markers are -20, -10, 0, 10, 20.
* **Legend:** Located in the top-right corner.
* `<zᵀHθz>` - Represented by a solid black line.
* `<κ^α>` - Represented by a dashed red line.
* **Label (a):** Located in the top-left corner. Its purpose is unclear without further context.
* **Horizontal dashed line:** A grey dashed line at y=0.
### Detailed Analysis
* **`<zᵀHθz>` (Black Line):** The black line starts at approximately 16 at S=1, rapidly decreases to around -12 at S=5, oscillates significantly between approximately -15 and 5 until S=100. After S=100, the line stabilizes, fluctuating around a value close to 0, with values ranging from approximately -5 to 5.
* **`<κ^α>` (Red Line):** The red line begins at approximately 8 at S=1, decreases to around -4 at S=5, and then exhibits oscillations, though less pronounced than the black line. From S=100 onwards, the red line also stabilizes, fluctuating around a value close to 0, with values ranging from approximately -3 to 3.
* **Initial Behavior (S=1 to S=10):** Both lines show a significant drop in their estimated values as the number of samples increases from 1 to 10. The black line exhibits more dramatic fluctuations during this period.
* **Stabilization (S>100):** Both lines converge towards a value near 0 as the number of samples increases beyond 100. The fluctuations become less pronounced, suggesting a degree of convergence.
### Key Observations
* The initial estimates for both `<zᵀHθz>` and `<κ^α>` are relatively high and decrease rapidly with increasing sample size.
* The `<zᵀHθz>` estimate is more volatile than the `<κ^α>` estimate, especially in the initial stages (S < 100).
* Both estimates appear to converge towards 0 as the number of samples increases, suggesting a potential bias reduction with larger sample sizes.
* The horizontal dashed line at y=0 serves as a reference point for assessing the convergence of the estimates.
### Interpretation
The chart likely demonstrates the behavior of estimators for certain quantities related to a model parameter θ. The `<zᵀHθz>` and `<κ^α>` terms could represent different measures of model complexity or goodness of fit. The logarithmic scale on the x-axis suggests that the convergence behavior is being examined over a wide range of sample sizes.
The initial high estimates and subsequent decrease suggest that the estimators are biased for small sample sizes. The convergence towards 0 as the sample size increases indicates that the bias is reduced with more data. The more volatile behavior of `<zᵀHθz>` might imply that it is a more sensitive estimator or that it is influenced by factors that are more susceptible to sampling variability.
The label "(a)" could indicate that this is part of a larger series of plots or experiments. Without additional context, it is difficult to determine the specific meaning of the quantities being estimated or the underlying model being used. The chart suggests that a sufficient number of samples (likely >100) are needed to obtain reasonably stable estimates of these quantities.