## Line Graph: Estimate of tr(Hθ) vs. Number of Samples S
### Overview
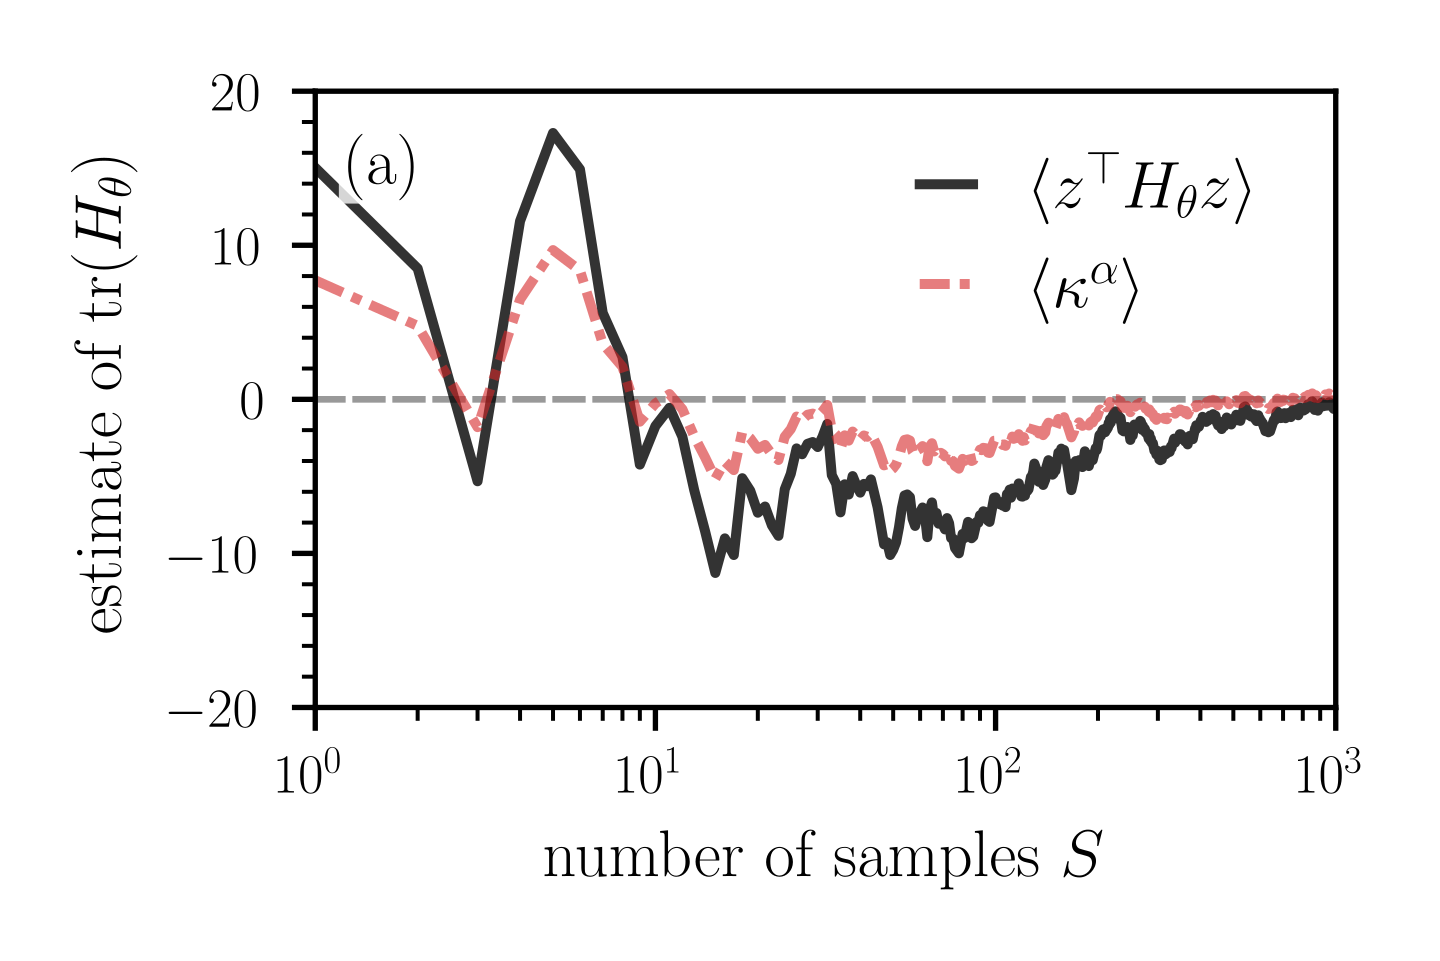
The graph depicts two time series trends (⟨zᵀHθz⟩ and ⟨κα⟩) plotted against a logarithmic scale of sample size (S). Both series exhibit initial volatility followed by stabilization, with convergence observed at larger sample sizes.
### Components/Axes
- **X-axis**: "number of samples S" (logarithmic scale: 10⁰ to 10³)
- **Y-axis**: "estimate of tr(Hθ)" (linear scale: -20 to 20)
- **Legend**:
- Solid black line: ⟨zᵀHθz⟩
- Dashed red line: ⟨κα⟩
- **Reference line**: Horizontal dashed gray line at y=0
### Detailed Analysis
1. **⟨zᵀHθz⟩ (Black Line)**:
- **S=10⁰**: Starts at ~15
- **S=10¹**: Drops sharply to ~-10
- **S=10²**: Fluctuates between -5 and 5
- **S=10³**: Stabilizes near 0 with minor oscillations (~±2)
2. **⟨κα⟩ (Red Dashed Line)**:
- **S=10⁰**: Begins at ~5
- **S=10¹**: Plummets to ~-15
- **S=10²**: Rises to ~-2
- **S=10³**: Converges with ⟨zᵀHθz⟩ near 0
### Key Observations
- Both series show **initial divergence** (S=10⁰–10¹) followed by **gradual convergence** (S=10²–10³).
- ⟨zᵀHθz⟩ exhibits **larger amplitude fluctuations** early on but recovers faster.
- ⟨κα⟩ demonstrates a **deeper initial trough** but slower recovery.
- Both lines **cross the zero reference line** between S=10¹ and S=10².
- Final convergence at S=10³ suggests **asymptotic stability** toward tr(Hθ) = 0.
### Interpretation
The graph illustrates how estimation error for two matrix traces (⟨zᵀHθz⟩ and ⟨κα⟩) evolves with increasing sample size. The logarithmic x-axis emphasizes performance across orders of magnitude in data collection. Key insights:
1. **Early Instability**: Both estimators show high variance in initial samples (S<10²), likely due to insufficient data for reliable trace estimation.
2. **Convergence Mechanism**: The shared asymptotic behavior (S≥10²) implies that both methods achieve similar accuracy with sufficient samples, despite differing initial performance.
3. **Zero-Centered Recovery**: The horizontal reference line at tr(Hθ)=0 suggests this is the true value being estimated, with both methods correcting toward it as S increases.
4. **Method Comparison**: ⟨zᵀHθz⟩ appears more robust to early-sample noise but requires more samples for final stabilization compared to ⟨κα⟩.
*Note: All values are approximate due to the absence of gridlines. The convergence pattern suggests potential applications in statistical learning or signal processing where trace estimation stability is critical.*