## Diagram: AI Tutoring System
### Overview
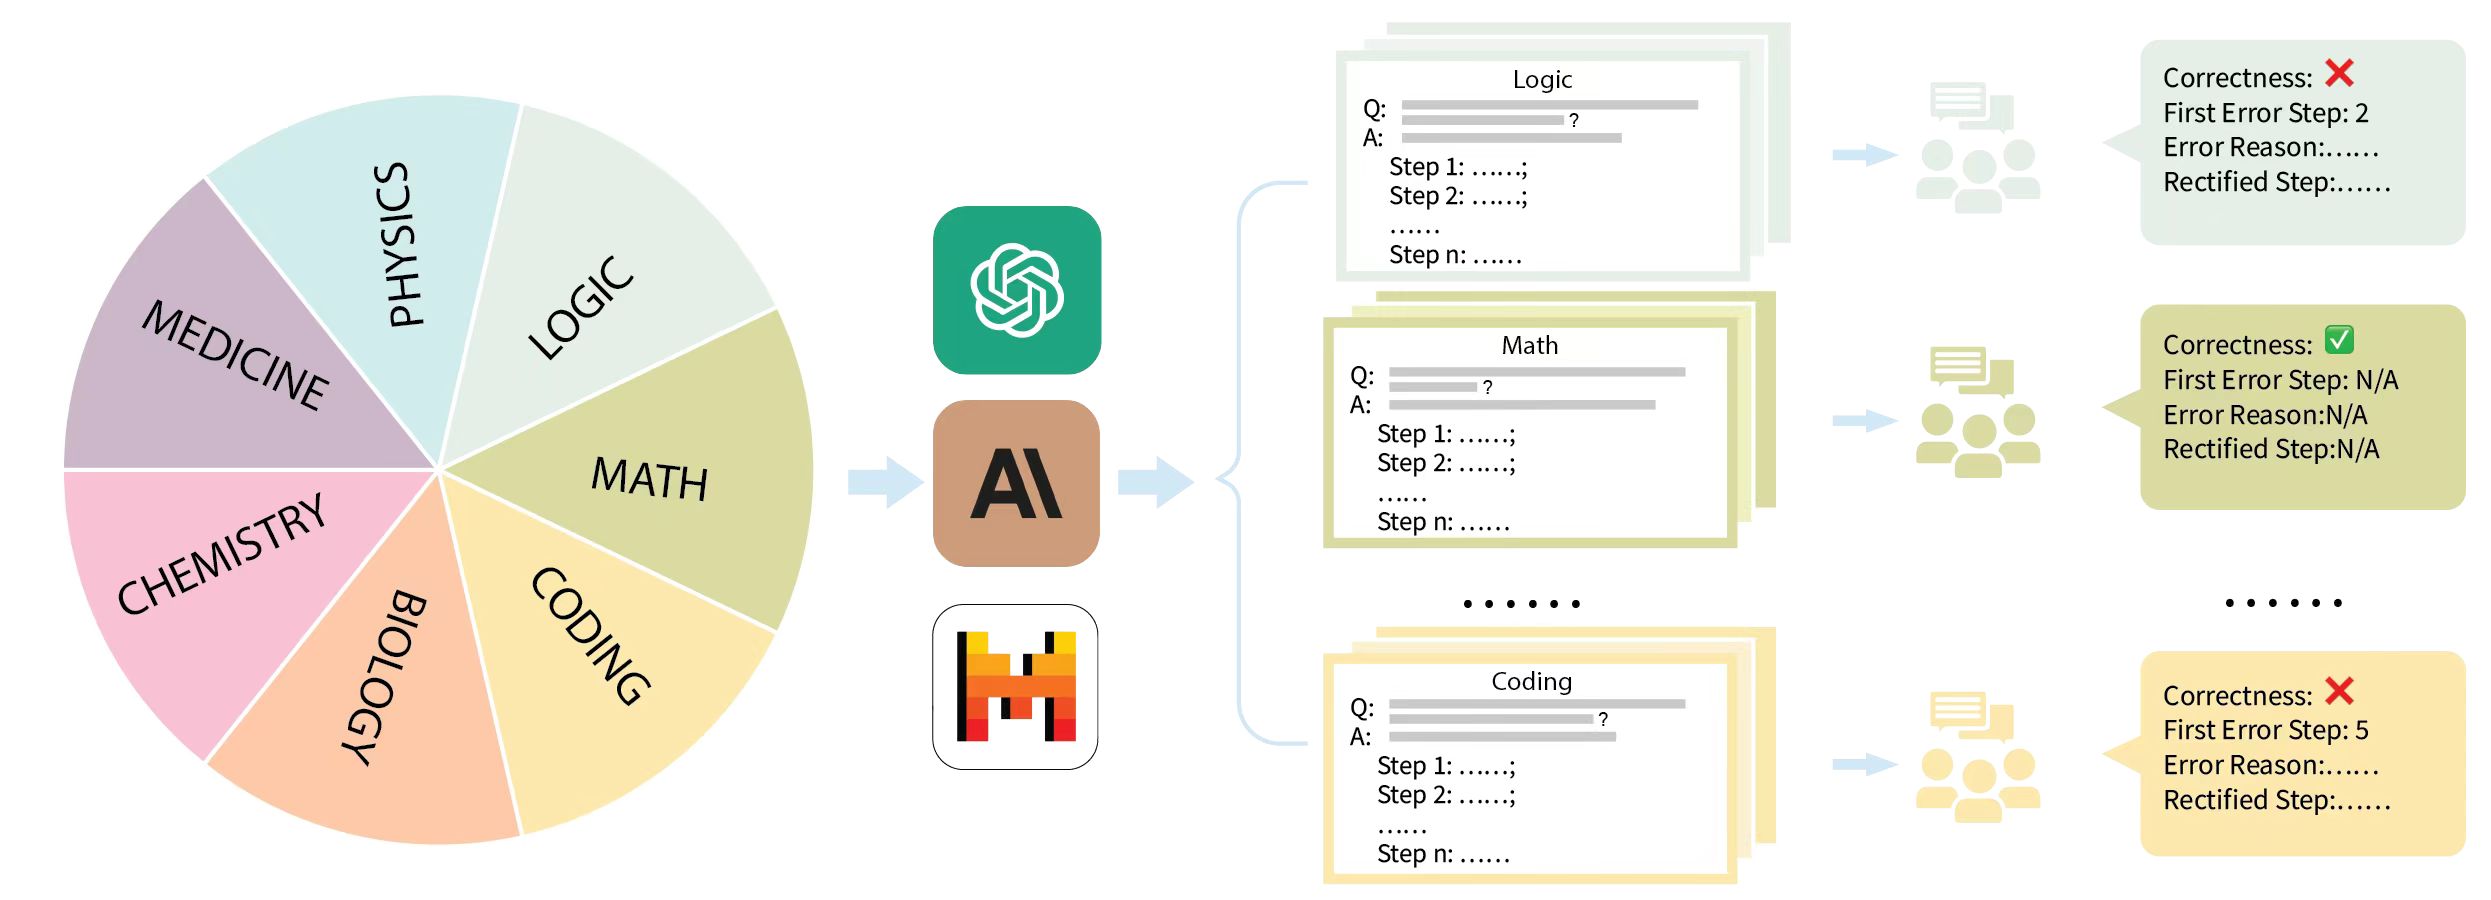
The image illustrates a conceptual diagram of an AI tutoring system. It shows a pie chart representing different subjects, which are then processed by AI models, resulting in feedback on the correctness of solutions.
### Components/Axes
* **Pie Chart:** Divided into seven segments, each representing a subject: Medicine, Chemistry, Biology, Coding, Math, Logic, and Physics.
* **AI Processing:** Three AI icons are shown: a green icon resembling the ChatGPT logo, a brown "AI" icon, and a red/orange icon resembling the Wolfram Alpha logo.
* **Problem/Solution Cards:** Represented as stacks of cards for Logic, Math, and Coding. Each card contains a "Q:" (Question) and "A:" (Answer) section, followed by multiple "Step" lines.
* **Feedback:** Each subject's solution is followed by an icon of people discussing, and a feedback card indicating "Correctness," "First Error Step," "Error Reason," and "Rectified Step."
### Detailed Analysis
* **Pie Chart Subjects:**
* Medicine (purple)
* Chemistry (pink)
* Biology (orange)
* Coding (yellow)
* Math (light green)
* Logic (light green)
* Physics (light blue)
* **AI Processing Icons:**
* ChatGPT-like icon (green)
* "AI" icon (brown)
* Wolfram Alpha-like icon (red/orange)
* **Problem/Solution Card Details:**
* Each card has a "Q:" and "A:" section, followed by "Step 1:", "Step 2:", and "Step n:".
* The content of the "Q:" and "A:" sections is obscured, represented by gray lines.
* The "Step" lines are followed by ellipses.
* **Feedback Card Details:**
* Logic: "Correctness: X", "First Error Step: 2", "Error Reason: ...", "Rectified Step: ..."
* Math: "Correctness: ✓", "First Error Step: N/A", "Error Reason: N/A", "Rectified Step: N/A"
* Coding: "Correctness: X", "First Error Step: 5", "Error Reason: ...", "Rectified Step: ..."
### Key Observations
* The diagram illustrates a flow from subject selection to AI processing to feedback on solutions.
* The feedback indicates that the Math problem was solved correctly, while Logic and Coding problems had errors.
* The "First Error Step" is specified for incorrect solutions, suggesting a step-by-step analysis.
### Interpretation
The diagram represents a conceptual AI tutoring system that covers multiple subjects. The system takes a problem, processes it through AI models, and provides feedback on the correctness of the solution, including the first error step and potential rectification. The use of different AI icons suggests that the system may leverage multiple AI models for different tasks or subjects. The diagram highlights the potential of AI to provide personalized and detailed feedback in education. The "N/A" values for the Math problem suggest that the system can also identify correct solutions.