TECHNICAL ASSET FINGERPRINT
7ee6573927436e281089e357
Click to view fullscreen
Press ESC or click to close
FOUND IN PAPERS
EXPERT: gemini-3.1-pro-preview VERSION 2
RUNTIME: nugit/gemini/gemini-3.1-pro-preview
INTEL_VERIFIED
## Diagram: Multi-Domain AI Reasoning Evaluation Pipeline
### Overview
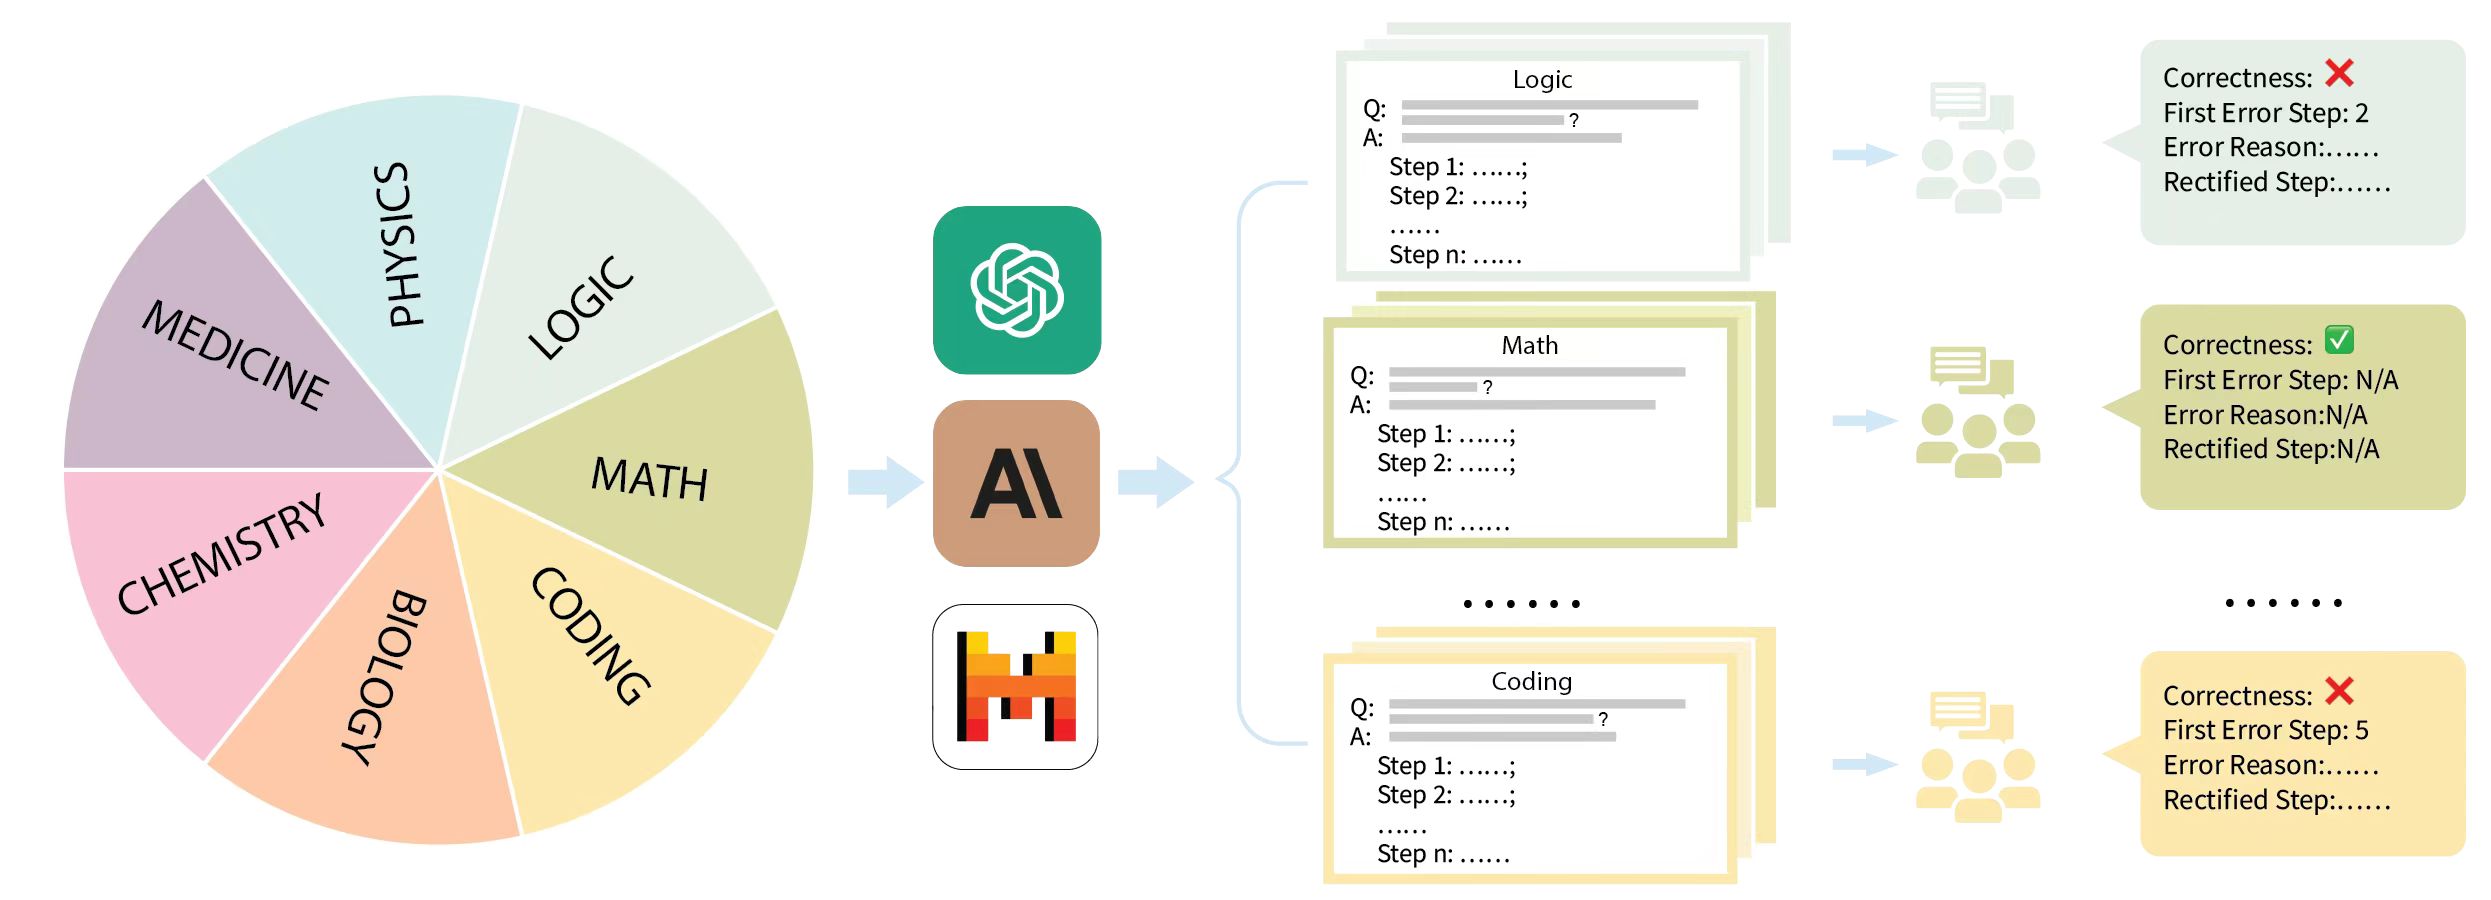
This image is a process flow diagram illustrating a methodology for evaluating Large Language Models (LLMs) on complex, multi-step reasoning tasks across various scientific and technical domains. The flow moves from left to right, starting with a diverse dataset of domain-specific questions, passing them through specific AI models to generate step-by-step answers, and concluding with human evaluation to identify and rectify specific logical errors within the generated steps.
### Components Isolation & Spatial Grounding
The diagram is divided into four distinct vertical sections, flowing from left to right, connected by light blue arrows:
1. **Far Left (Input Domain):** A segmented pie chart representing the subject matter dataset.
2. **Center-Left (Processing):** A vertical stack of three prominent AI model logos.
3. **Center-Right (Output Generation):** Stacks of generated text cards, color-coded to match the input domains, showing step-by-step reasoning.
4. **Far Right (Evaluation):** Human annotator icons leading to color-coded evaluation result boxes detailing correctness and error localization.
---
### Content Details & Transcription
#### 1. Input Domains (Far Left)
A 7-slice pie chart. The slices appear roughly equal in size, suggesting a balanced dataset.
* **Top Right:** LOGIC (Light Green)
* **Right:** MATH (Olive Green)
* **Bottom Right:** CODING (Light Orange/Yellow)
* **Bottom:** BIOLOGY (Orange)
* **Bottom Left:** CHEMISTRY (Pink)
* **Left:** MEDICINE (Purple)
* **Top Left:** PHYSICS (Light Blue)
*Flow:* A light blue arrow points from the right edge of the pie chart to the AI models.
#### 2. AI Models (Center-Left)
Three vertically stacked, rounded-square icons representing the LLMs being evaluated:
* **Top:** OpenAI logo (White swirling geometric shape on a teal/green background).
* **Middle:** Anthropic / Claude logo (Stylized black "A" and backslash on a tan/brown background).
* **Bottom:** Mistral AI logo (Stylized "M" made of orange, red, and black blocks on a white background).
*Flow:* A light blue arrow points from these models, splitting into a large bracket `{` that encompasses the output cards to the right.
#### 3. Generated Outputs (Center-Right)
Three visible stacks of cards representing the models' outputs. The borders of these cards are color-coded to match the pie chart slices.
* **Top Stack (Light Green border - matches LOGIC):**
* Header: `Logic`
* Body Text:
```text
Q: [grey line representing text] ?
A: [grey line representing text]
Step 1: ......;
Step 2: ......;
......
Step n: ......
```
* **Middle Stack (Olive Green border - matches MATH):**
* Header: `Math`
* Body Text: Identical structure to the Logic card (Q, A, Step 1 to Step n).
* **Separator:** Six black dots (`......`) indicating omitted categories (likely Biology, Chemistry, Medicine, Physics).
* **Bottom Stack (Light Orange/Yellow border - matches CODING):**
* Header: `Coding`
* Body Text: Identical structure to the Logic card.
*Flow:* A light blue arrow points from each card stack to an icon of three human figures with a chat bubble (representing human annotators/evaluators).
#### 4. Human Evaluation Results (Far Right)
Arrows point from the human annotator icons to evaluation boxes. These boxes share the background color of their corresponding domain.
* **Top Box (Light Green background - Logic Evaluation):**
```text
Correctness: ❌
First Error Step: 2
Error Reason:......
Rectified Step:......
```
* **Middle Box (Olive Green background - Math Evaluation):**
```text
Correctness: ✅
First Error Step: N/A
Error Reason:N/A
Rectified Step:N/A
```
* **Separator:** Six black dots (`......`) aligning with the omitted categories.
* **Bottom Box (Light Orange/Yellow background - Coding Evaluation):**
```text
Correctness: ❌
First Error Step: 5
Error Reason:......
Rectified Step:......
```
---
### Key Observations
* **Color-Coding Consistency:** There is a strict visual mapping using color. The "Logic" slice in the pie chart is light green, the generated output cards for Logic have a light green border, and the final evaluation box for Logic has a light green background. This pattern holds true for Math (olive green) and Coding (yellow/orange).
* **Chain-of-Thought Structure:** The generated outputs explicitly use a "Step 1, Step 2... Step n" format. This indicates the models are prompted to use Chain-of-Thought (CoT) reasoning rather than providing direct answers.
* **Granular Evaluation:** The evaluation metrics go beyond simple binary pass/fail (`Correctness: ✅ / ❌`). When an answer is incorrect, the evaluators identify the exact point of failure (`First Error Step`), explain why it failed (`Error Reason`), and provide the correct logical step (`Rectified Step`).
---
### Interpretation
This diagram outlines a sophisticated framework for benchmarking the reasoning capabilities of state-of-the-art Large Language Models (specifically OpenAI, Anthropic, and Mistral models).
**Reading between the lines (Peircean investigative analysis):**
1. **Process-Based vs. Outcome-Based Evaluation:** The inclusion of "First Error Step" and "Rectified Step" strongly suggests this methodology is designed to create or utilize a **Process Reward Model (PRM)** dataset. Instead of just grading the final answer (Outcome Reward Model), this approach evaluates the *trajectory* of the model's logic. This is crucial for complex STEM fields (Physics, Math, Coding) where a single arithmetic mistake in Step 2 can ruin a perfectly logical 10-step deduction.
2. **Human-in-the-Loop (HITL):** The explicit inclusion of human annotator icons indicates that automated evaluation (using another LLM as a judge) is deemed insufficient for this level of logical scrutiny. Human experts are required to trace the logic and pinpoint the exact moment the AI hallucinates or makes a logical leap.
3. **Dataset Creation:** Because the evaluation includes a "Rectified Step," this pipeline is not just testing models; it is actively generating a high-quality, human-corrected dataset. This corrected data can subsequently be used to fine-tune future models, teaching them not just what the right answer is, but how to correct their specific logical missteps in various scientific domains.
DECODING INTELLIGENCE...