## Pie Chart: Academic Disciplines Distribution
### Overview
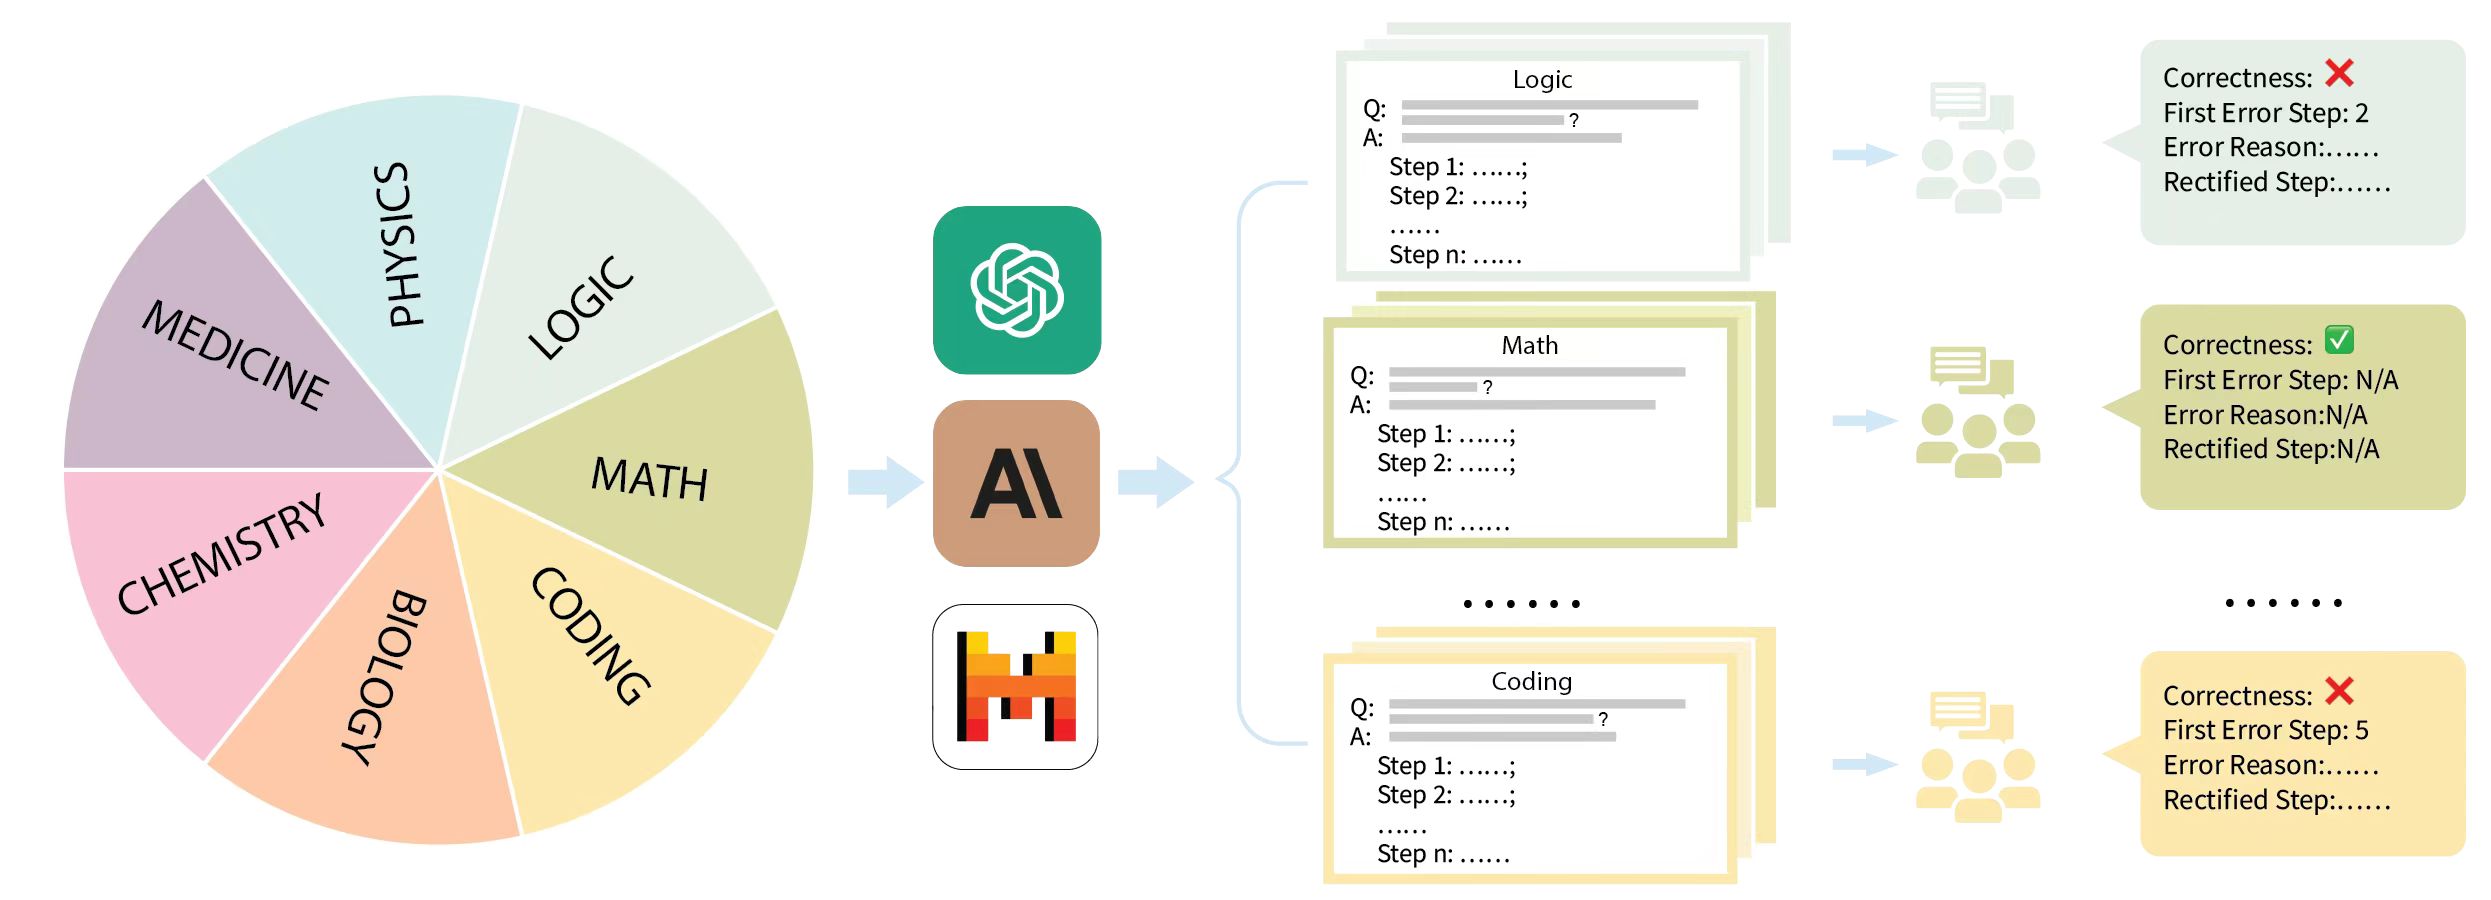
A circular pie chart divided into eight equal segments, each representing a different academic discipline. The chart uses distinct colors for each category and is positioned on the left side of the image.
### Components/Axes
- **Labels**:
- Medicine (purple)
- Physics (light blue)
- Logic (light green)
- Math (olive green)
- Coding (yellow)
- Biology (peach)
- Chemistry (pink)
- **Structure**:
- Eight equal-sized segments (12.5% each)
- No numerical values or percentages explicitly labeled
- Central white background with black text labels
### Detailed Analysis
- **Color Coding**:
- Medicine: #8A2BE2 (purple)
- Physics: #ADD8E6 (light blue)
- Logic: #90EE90 (light green)
- Math: #556B2F (olive green)
- Coding: #FFFF00 (yellow)
- Biology: #FFDAB9 (peach)
- Chemistry: #FFC0CB (pink)
- **Spatial Positioning**:
- Pie chart occupies the left third of the image
- Segments arranged clockwise starting from top-left (Physics)
### Key Observations
- All disciplines are represented equally (12.5% each)
- No overlapping or hierarchical relationships shown
- Color choices distinguish categories effectively
### Interpretation
The pie chart visually represents equal emphasis on seven core academic disciplines plus Logic. The equal segmentation suggests a balanced curriculum or research focus across these fields. The color selection uses high-contrast hues for clear differentiation, though the absence of numerical labels limits quantitative interpretation.
## Flowchart: AI-Human Collaboration Process
### Overview
A horizontal flowchart on the right side of the image depicting an iterative process between AI systems and human collaborators. The process involves three academic disciplines (Logic, Math, Coding) with feedback loops for error correction.
### Components/Axes
- **Central Node**:
- Brown square labeled "AI" with black "A" and "I" text
- **Input Sources**:
- Green square (ResearchGate logo)
- Orange square (Hacker News logo)
- Red square (H logo)
- **Output Sections**:
- Logic (light green)
- Math (olive green)
- Coding (yellow)
- **Feedback Elements**:
- Correctness indicators (red X or green check)
- Error step identification
- Rectified step suggestions
### Detailed Analysis
- **Process Flow**:
1. Input sources → AI processing
2. AI outputs → Three discipline-specific sections
3. Human feedback → Correctness evaluation
4. Error correction → Rectified steps
- **Color Coding**:
- Logic: #98FB98 (light green)
- Math: #90EE90 (olive green)
- Coding: #FFFFE0 (yellow)
- **Spatial Positioning**:
- AI node centered in flowchart
- Input sources arranged above AI node
- Discipline sections arranged horizontally below AI node
- Feedback bubbles positioned to the right of each section
### Key Observations
- Logic section shows first error at step 2
- Math section has no errors (N/A)
- Coding section has first error at step 5
- Feedback bubbles use speech bubble icons with text
- Process emphasizes iterative improvement through human-AI collaboration
### Interpretation
The flowchart illustrates a quality assurance process where AI-generated academic content undergoes human review. The varying error patterns across disciplines suggest:
1. Math problems may be more algorithmically solvable
2. Logic requires careful step-by-step verification
3. Coding involves complex error detection at later stages
The feedback loop mechanism demonstrates the value of human-AI collaboration in academic problem-solving, with the system designed to identify and correct errors through iterative refinement.