## Bar Chart: Relative Speedup Ratio of Cache-MoE vs ExpertFlow
### Overview
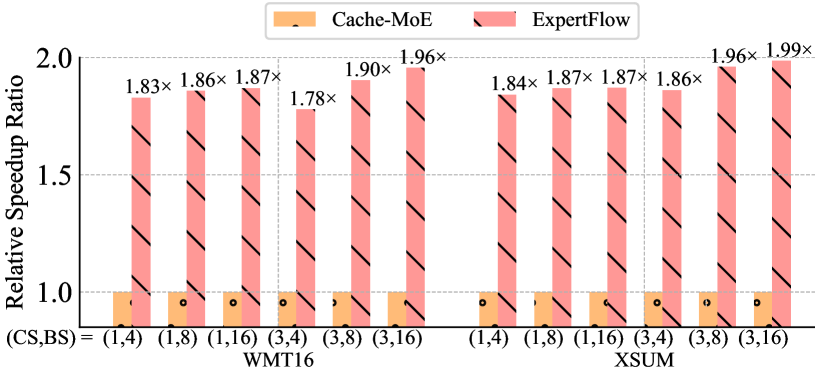
The chart compares the relative speedup ratio of two methods, **Cache-MoE** (orange) and **ExpertFlow** (pink with diagonal stripes), across different computational configurations. The x-axis represents parameter combinations (e.g., (1,4), (1,8), etc.), while the y-axis shows the speedup ratio relative to a baseline (1.0). Data is split into two domains: **WMT16** (left) and **XSUM** (right).
---
### Components/Axes
- **X-Axis**:
- **Categories**:
- **WMT16**: (1,4), (1,8), (1,16), (3,4), (3,8), (3,16)
- **XSUM**: (1,4), (1,8), (1,16), (3,4), (3,8), (3,16)
- **Labels**: "(CS,BS) = (1,4)", "(1,8)", etc.
- **Y-Axis**:
- **Title**: "Relative Speedup Ratio"
- **Scale**: 1.0 to 2.0 (increments of 0.1)
- **Legend**:
- **Top-right**:
- **Cache-MoE**: Orange square
- **ExpertFlow**: Pink bar with diagonal stripes
---
### Detailed Analysis
#### WMT16 Domain
- **Cache-MoE**:
- All bars hover near **1.0** (e.g., 1.00x for (1,4), 1.01x for (1,8), etc.).
- **ExpertFlow**:
- Speedup increases with configuration size:
- (1,4): 1.83x
- (1,8): 1.86x
- (1,16): 1.87x
- (3,4): 1.78x
- (3,8): 1.90x
- (3,16): 1.96x
#### XSUM Domain
- **Cache-MoE**:
- Consistent near **1.0** (e.g., 1.00x for all configurations).
- **ExpertFlow**:
- Higher speedup than WMT16:
- (1,4): 1.84x
- (1,8): 1.87x
- (1,16): 1.87x
- (3,4): 1.86x
- (3,8): 1.96x
- (3,16): 1.99x
---
### Key Observations
1. **ExpertFlow Dominates**:
- ExpertFlow consistently outperforms Cache-MoE across all configurations, with speedup ratios ranging from **1.78x to 1.99x**.
2. **Scaling Trends**:
- Larger configurations (e.g., (3,16)) yield higher speedups for ExpertFlow, especially in XSUM.
- Cache-MoE shows minimal improvement with scaling, remaining close to 1.0.
3. **Domain Differences**:
- XSUM achieves higher speedups than WMT16 for ExpertFlow, suggesting domain-specific efficiency gains.
---
### Interpretation
- **Performance Implications**:
- ExpertFlow’s ability to scale with configuration size (e.g., 1.99x in XSUM (3,16)) highlights its efficiency for complex tasks. Cache-MoE’s stagnant performance suggests limitations in handling larger parameter sets.
- **Methodology Insights**:
- The diagonal stripes in ExpertFlow’s bars may indicate dynamic resource allocation or parallelization advantages over Cache-MoE’s static approach.
- **Outliers**:
- The (3,4) configuration in WMT16 (1.78x) is an outlier for ExpertFlow, underperforming compared to other setups. This could indicate suboptimal tuning for specific parameter combinations.
---
### Spatial Grounding & Verification
- **Legend Alignment**:
- Orange squares (Cache-MoE) match all orange bars; pink striped bars (ExpertFlow) align with their legend entry.
- **Trend Verification**:
- ExpertFlow’s upward trend in XSUM (1.84x → 1.99x) is visually confirmed by increasing bar heights.
- **Component Isolation**:
- WMT16 and XSUM are spatially separated, with distinct y-axis ranges for clarity.
---
### Conclusion
The chart demonstrates that **ExpertFlow** significantly outperforms **Cache-MoE** in both domains, with speedup ratios increasing as configurations scale. This suggests ExpertFlow is better suited for resource-intensive applications, while Cache-MoE may struggle with larger parameter sets. Further investigation into the (3,4) WMT16 outlier could reveal optimization opportunities.