## Line Graphs: FAD Performance vs. 1/N for Audio Models
### Overview
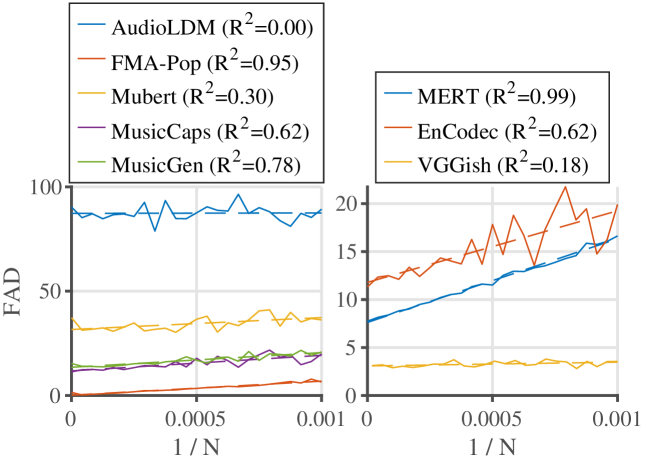
The image contains two side-by-side line graphs comparing the performance of audio models across different sample sizes (1/N). The left graph evaluates five models (AudioLDM, FMA-Pop, Mubert, MusicCaps, MusicGen) with FAD scores ranging from 0 to 100. The right graph compares three models (MERT, EnCodec, VGGish) with FAD scores from 0 to 20. All graphs plot FAD against 1/N, with R² values indicating correlation strength.
### Components/Axes
- **Left Graph**:
- **Y-axis**: FAD (0–100)
- **X-axis**: 1/N (0–0.001)
- **Legend**:
- AudioLDM (blue, R²=0.00)
- FMA-Pop (orange, R²=0.95)
- Mubert (yellow, R²=0.30)
- MusicCaps (purple, R²=0.62)
- MusicGen (green, R²=0.78)
- **Right Graph**:
- **Y-axis**: FAD (0–20)
- **X-axis**: 1/N (0–0.001)
- **Legend**:
- MERT (blue, R²=0.99)
- EnCodec (orange, R²=0.62)
- VGGish (yellow, R²=0.18)
### Detailed Analysis
#### Left Graph Trends
1. **AudioLDM (blue)**: Flat line at ~95 FAD, no correlation with 1/N (R²=0.00).
2. **FMA-Pop (orange)**: Linear increase from ~10 to ~20 FAD (R²=0.95).
3. **Mubert (yellow)**: Wavy line (~30–40 FAD), minimal correlation (R²=0.30).
4. **MusicCaps (purple)**: Slight upward trend (~10–15 FAD) (R²=0.62).
5. **MusicGen (green)**: Steady increase from ~5 to ~20 FAD (R²=0.78).
#### Right Graph Trends
1. **MERT (blue)**: Linear rise from ~5 to ~15 FAD (R²=0.99).
2. **EnCodec (orange)**: Volatile line (~10–18 FAD) with peaks (R²=0.62).
3. **VGGish (yellow)**: Flat line (~3–4 FAD), no correlation (R²=0.18).
### Key Observations
- **High R² Values**: MERT (0.99) and FMA-Pop (0.95) show strong linear relationships between FAD and 1/N.
- **Low R² Values**: AudioLDM (0.00) and VGGish (0.18) exhibit near-zero correlation.
- **Performance Variability**: EnCodec’s fluctuating FAD suggests inconsistent performance across sample sizes.
- **Model Efficiency**: MusicGen (R²=0.78) and MERT (R²=0.99) demonstrate the most predictable scaling with sample size.
### Interpretation
The graphs highlight how FAD performance correlates with sample size (1/N) across audio models. High R² values (e.g., MERT, FMA-Pop) indicate models where FAD scales predictably as sample size decreases. Conversely, low R² values (AudioLDM, VGGish) suggest FAD remains stable or insensitive to sample size changes. The right graph’s MERT model stands out with near-perfect linear scaling, implying optimal performance predictability. EnCodec’s volatility (R²=0.62) may reflect architectural complexity or dataset-specific limitations. These trends could inform model selection for tasks requiring sample efficiency or stability.