## Diagram: Attention Mechanism Data Flow
### Overview
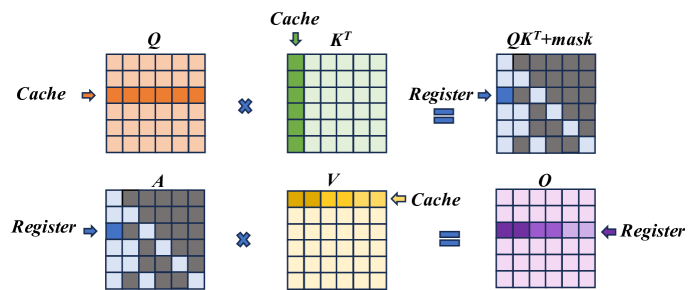
The image illustrates the data flow within an attention mechanism, likely in a neural network. It shows matrix operations involving Query (Q), Key (K), Value (V), and Output (O) matrices, highlighting the use of cache and register memory.
### Components/Axes
* **Matrices:** The diagram features several matrices labeled as Q, K<sup>T</sup>, QK<sup>T</sup>+mask, A, V, and O. Each matrix is represented as a grid of cells.
* **Labels:** The labels "Cache" and "Register" indicate memory access patterns. Arrows point to specific rows or columns within the matrices to show where data is being accessed from cache or register.
* **Operators:** Multiplication symbols (x) and equality symbols (=) denote matrix operations.
### Detailed Analysis
The diagram can be broken down into two main rows, each representing a step in the attention mechanism.
**Row 1:**
1. **Q (Query):** A 7x7 matrix. A horizontal row in the middle is highlighted in orange, with an arrow labeled "Cache" pointing to it from the left.
2. **K<sup>T</sup> (Key Transpose):** A 7x7 matrix. A vertical column on the left is highlighted in green, with an arrow labeled "Cache" pointing to it from the top.
3. **QK<sup>T</sup>+mask:** A 7x7 matrix. The matrix contains a pattern of dark gray and light blue cells. A single cell in the top-left corner is highlighted in blue, with an arrow labeled "Register" pointing to it from the left.
**Row 2:**
1. **A:** A 7x7 matrix. The matrix contains a pattern of dark gray and light blue cells. A single cell in the top-left corner is highlighted in blue, with an arrow labeled "Register" pointing to it from the left.
2. **V (Value):** A 7x7 matrix. A horizontal row at the top is highlighted in yellow, with an arrow labeled "Cache" pointing to it from the right.
3. **O (Output):** A 7x7 matrix. A horizontal row in the middle is highlighted with varying shades of purple, with an arrow labeled "Register" pointing to it from the right.
### Key Observations
* The "Cache" arrows indicate that specific rows or columns of the matrices are being accessed from the cache memory.
* The "Register" arrows indicate that single elements of the matrices are being accessed from the register memory.
* The "QK<sup>T</sup>+mask" and "A" matrices have a similar pattern of dark gray and light blue cells, suggesting a masking operation.
* The "O" matrix has a gradient of purple, indicating a weighted sum or aggregation of values.
### Interpretation
The diagram illustrates the core operations of an attention mechanism. The Query (Q) and Key (K<sup>T</sup>) matrices are used to compute attention weights, which are then applied to the Value (V) matrix to produce the Output (O). The "mask" in "QK<sup>T</sup>+mask" suggests that certain elements are being masked out during the attention weight calculation. The use of cache and register memory highlights the importance of memory access patterns in optimizing the performance of the attention mechanism. The diagram suggests that the attention mechanism is processing data in a row-wise or column-wise manner, as indicated by the "Cache" arrows. The final output "O" is a weighted combination of the "V" matrix, where the weights are determined by the attention mechanism.