## Diagram: Matrix Operations in Attention Mechanism
### Overview
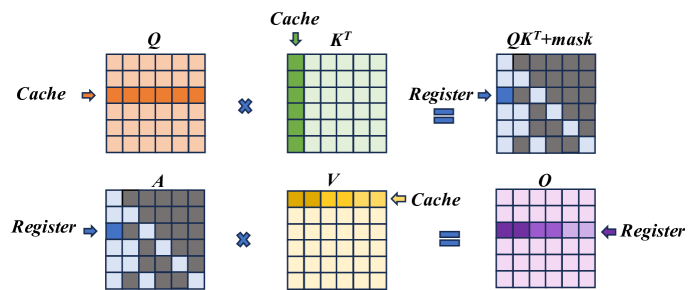
The diagram illustrates a sequence of matrix operations involving **Q (Query)**, **Kᵀ (Key Transpose)**, **V (Value)**, and **O (Output)**. It shows data flow between **Cache** and **Register** components, with operations like matrix multiplication (`QKᵀ`), masking, and storage. The process resembles steps in an attention mechanism (e.g., transformer models).
### Components/Axes
- **Matrices**:
- **Q**: Pink matrix (top-left).
- **Kᵀ**: Green matrix (top-center).
- **V**: Yellow matrix (bottom-center).
- **O**: Purple matrix (bottom-right).
- **Operations**:
- `QKᵀ+mask`: Result of multiplying Q and Kᵀ, then applying a mask.
- Arrows indicate data flow:
- **Cache → Register**: Q and Kᵀ are moved from Cache to Register.
- **Register → Cache**: V is moved from Register to Cache.
- **Register → Register**: Final output O is stored in Register.
- **Key Elements**:
- **Mask**: Applied to `QKᵀ` (top-right matrix).
- **X Symbols**: Represent matrix multiplication operations.
- **Color Coding**:
- Pink (Q), Green (Kᵀ), Yellow (V), Purple (O).
- Gray/White blocks in matrices likely represent zero or inactive values.
### Detailed Analysis
1. **Top Row**:
- **Q (Cache)**: A pink matrix with a horizontal orange stripe (highlighted row).
- **Kᵀ (Cache)**: A green matrix with a vertical green stripe (highlighted column).
- **QKᵀ+mask (Register)**: Result of multiplying Q and Kᵀ, then applying a mask. The mask zeros out certain values (gray blocks).
2. **Bottom Row**:
- **A (Register)**: A gray matrix with scattered blue blocks (possibly attention weights).
- **V (Cache)**: A yellow matrix with a gradient of yellow blocks (highlighted row).
- **O (Register)**: A purple matrix with a horizontal purple stripe (result of combining A and V).
### Key Observations
- **Flow Direction**:
- Q and Kᵀ are processed in the top row, while V and O are processed in the bottom row.
- Masking occurs after `QKᵀ` multiplication to filter irrelevant values.
- **Color Significance**:
- Highlighted rows/columns (orange, green, yellow) likely represent active or important data.
- Masking introduces sparsity (gray blocks) in the `QKᵀ+mask` matrix.
- **No Numerical Data**: The diagram focuses on structural relationships, not quantitative values.
### Interpretation
This diagram represents a simplified attention mechanism workflow:
1. **Query-Key Interaction**: Q and Kᵀ are multiplied to compute attention scores (`QKᵀ`).
2. **Masking**: Irrelevant scores are masked out (e.g., padding tokens in NLP).
3. **Value Aggregation**: The masked scores are used to weight the Value matrix (V), producing the final Output (O).
4. **Memory Management**: Cache and Register act as intermediate storage, optimizing data access.
The process emphasizes efficiency in handling large matrices, critical for transformer models. The use of masking and color-coded highlights suggests optimization for sparse data and attention to specific elements.