## Line Chart: LLM-as-a-Judge vs. Max Iterations
### Overview
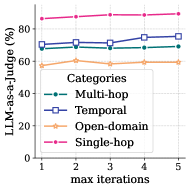
The image is a line chart comparing the performance of a Large Language Model (LLM) as a judge across different categories (Multi-hop, Temporal, Open-domain, and Single-hop) with varying maximum iterations (1 to 5). The y-axis represents the percentage of LLM-as-a-Judge, and the x-axis represents the maximum iterations.
### Components/Axes
* **X-axis:** "max iterations" with values 1, 2, 3, 4, and 5.
* **Y-axis:** "LLM-as-a-Judge (%)" with values ranging from 0 to 80.
* **Legend:** Located in the center-right of the chart.
* **Multi-hop:** Represented by a dashed teal line with circular markers.
* **Temporal:** Represented by a solid dark blue line with square markers.
* **Open-domain:** Represented by a solid light orange line with star markers.
* **Single-hop:** Represented by a dashed magenta line with circular markers.
### Detailed Analysis
* **Multi-hop:** The teal dashed line starts at approximately 68% at iteration 1, remains relatively stable around 68% at iteration 2, then slightly decreases to 67% at iteration 3, increases to 70% at iteration 4, and ends at approximately 69% at iteration 5.
* **Temporal:** The dark blue solid line starts at approximately 70% at iteration 1, increases to 72% at iteration 2, remains relatively stable around 72% at iteration 3, increases to 74% at iteration 4, and ends at approximately 75% at iteration 5.
* **Open-domain:** The light orange solid line starts at approximately 57% at iteration 1, increases to 60% at iteration 2, decreases to 58% at iteration 3, increases to 59% at iteration 4, and ends at approximately 59% at iteration 5.
* **Single-hop:** The magenta dashed line starts at approximately 85% at iteration 1, increases to 87% at iteration 2, remains relatively stable around 87% at iteration 3, increases to 88% at iteration 4, and ends at approximately 88% at iteration 5.
### Key Observations
* The "Single-hop" category consistently outperforms the other categories across all iterations.
* The "Open-domain" category consistently underperforms the other categories across all iterations.
* The "Temporal" category shows a slight upward trend as the number of iterations increases.
* The "Multi-hop" category remains relatively stable across all iterations.
### Interpretation
The chart illustrates the performance of an LLM as a judge across different question types, with "Single-hop" questions being the easiest for the model to evaluate and "Open-domain" questions being the most challenging. The slight upward trend in the "Temporal" category suggests that increasing the number of iterations may improve the model's ability to judge temporal reasoning. The stability of the "Multi-hop" category indicates that increasing iterations does not significantly impact the model's performance on multi-hop reasoning tasks. The consistently high performance on "Single-hop" questions suggests that the model is well-suited for evaluating simple, direct questions.