## Line Chart: LLM-as-a-Judge Performance by Category
### Overview
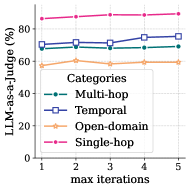
This image is a line chart illustrating the performance of a Large Language Model (LLM) across four distinct task categories as the number of "max iterations" increases. The performance is measured as a percentage using an "LLM-as-a-Judge" metric. The chart shows that while performance varies significantly between categories, it remains relatively stable or shows slight improvement as iterations increase from 1 to 5.
### Components/Axes
* **Vertical Axis (Y-axis):**
* **Label:** "LLM-as-a-Judge (%)"
* **Scale:** 0 to 100, with major tick marks and grid lines at intervals of 20 (0, 20, 40, 60, 80).
* **Horizontal Axis (X-axis):**
* **Label:** "max iterations"
* **Scale:** 1 to 5, with integer markers at 1, 2, 3, 4, and 5.
* **Legend:**
* **Title:** "Categories"
* **Placement:** Centered vertically on the left side of the plot area, partially overlapping the data lines.
* **Items:**
* **Multi-hop:** Teal/Dark Green line with solid circular markers.
* **Temporal:** Dark Blue/Purple line with open square markers.
* **Open-domain:** Light Orange/Peach line with open diamond/star markers.
* **Single-hop:** Pink/Magenta line with solid circular markers.
### Content Details
The chart tracks four data series across five iteration points.
| Category | Iteration 1 | Iteration 2 | Iteration 3 | Iteration 4 | Iteration 5 | Visual Trend |
| :--- | :---: | :---: | :---: | :---: | :---: | :--- |
| **Single-hop** (Pink) | ~86% | ~87% | ~88% | ~88% | ~89% | Stable, slight upward slope. |
| **Temporal** (Dark Blue) | ~71% | ~72% | ~71% | ~75% | ~76% | Upward trend with a minor dip at iteration 3. |
| **Multi-hop** (Teal) | ~68% | ~69% | ~68% | ~68% | ~69% | Very stable/flat. |
| **Open-domain** (Orange) | ~58% | ~60% | ~59% | ~60% | ~60% | Stable, slight initial rise then flat. |
### Key Observations
* **Performance Hierarchy:** There is a clear and consistent performance hierarchy across all iteration counts: Single-hop > Temporal > Multi-hop > Open-domain.
* **Stability:** Most categories show very little change in performance as iterations increase. The lines are largely horizontal.
* **Temporal Improvement:** The "Temporal" category shows the most significant relative improvement, gaining approximately 5 percentage points from iteration 1 to iteration 5.
* **Saturation:** Performance appears to plateau quickly. For most categories, there is no significant gain after 2 iterations.
### Interpretation
* **Task Complexity:** The data suggests that "Single-hop" tasks are the least complex for the model to handle, achieving high accuracy (~85-90%) almost immediately. Conversely, "Open-domain" tasks represent the highest complexity or highest uncertainty, with performance struggling to break the 60% threshold.
* **Iterative Gains:** The "max iterations" parameter likely refers to a reasoning or refinement process (like Chain-of-Thought or self-correction). The fact that performance does not increase dramatically suggests that the model either reaches its correct conclusion early or that additional iterations do not provide enough new information to correct initial errors.
* **Temporal Reasoning:** The slight upward trend in "Temporal" tasks suggests that these specific types of problems benefit more from iterative processing than static "Multi-hop" or "Open-domain" tasks, perhaps because temporal sequences require more steps of logical verification.
* **LLM-as-a-Judge Reliability:** Since the metric is "LLM-as-a-Judge," the results reflect the model's ability to satisfy a set of evaluative criteria. The high scores in "Single-hop" might indicate that these tasks are easier to evaluate objectively compared to the potentially more subjective or vast "Open-domain" tasks.