## Directed Graph Diagram: Temporal Entity Relationship Network
### Overview
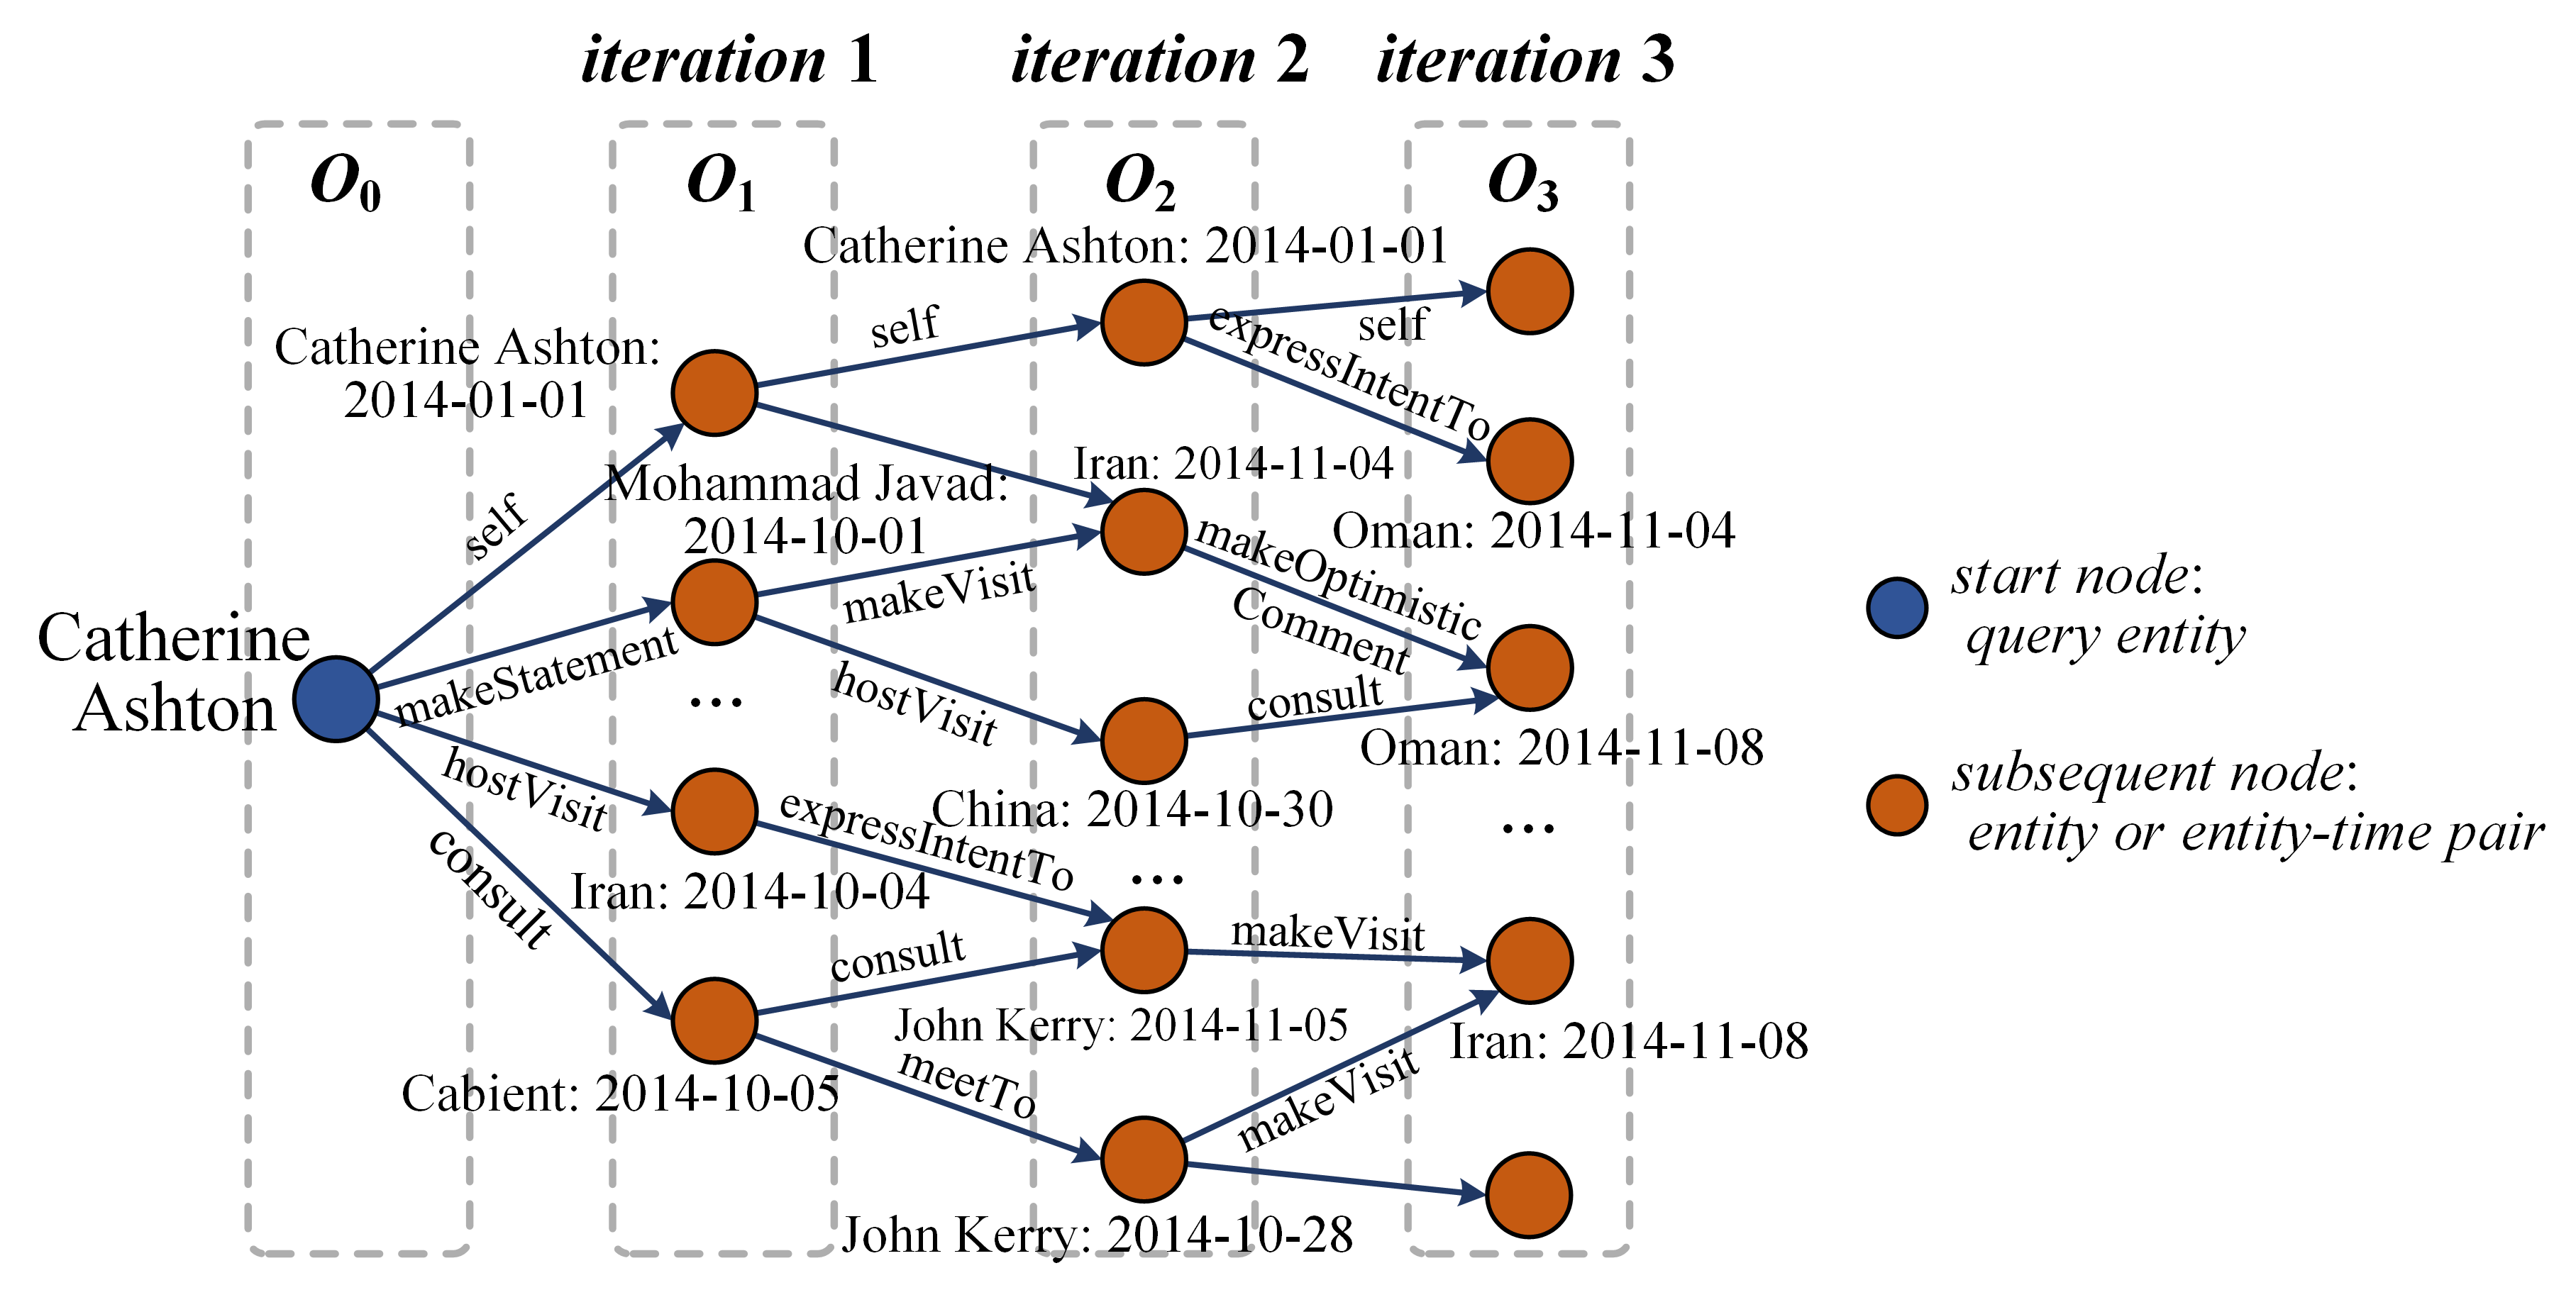
The image displays a directed graph diagram illustrating the expansion of relationships from a central query entity over three sequential iterations. The graph visualizes how an initial entity (Catherine Ashton) connects to other entities and entity-time pairs through specific actions, with the network growing in complexity from left to right. The diagram is structured into four vertical columns, each representing a stage or "observation" (O₀ to O₃), corresponding to the initial state and three subsequent iterations.
### Components/Axes
* **Structure:** The diagram is organized into four dashed-line rectangular columns, labeled at the top:
* **O₀:** The leftmost column, containing the start node.
* **O₁:** Labeled "iteration 1" at the top.
* **O₂:** Labeled "iteration 2" at the top.
* **O₃:** Labeled "iteration 3" at the top.
* **Legend (Right Side):**
* **Blue Circle:** "start node: query entity"
* **Orange Circle:** "subsequent node: entity or entity-time pair"
* **Node Types:**
* **Start Node (Blue):** A single blue circle in column O₀, labeled "Catherine Ashton".
* **Subsequent Nodes (Orange):** Multiple orange circles in columns O₁, O₂, and O₃. Each is labeled with an entity name and a date in `YYYY-MM-DD` format (e.g., "Catherine Ashton: 2014-01-01").
* **Edges:** Directed arrows (blue lines with arrowheads) connect nodes from left to right (from O₀ to O₁, O₁ to O₂, O₂ to O₃). Each edge has a text label describing the relationship or action (e.g., "makeStatement", "consult").
### Detailed Analysis
**Node Inventory by Column:**
* **Column O₀:**
* Node: `Catherine Ashton` (Blue, Start Node)
* **Column O₁ (Iteration 1):**
* Node 1: `Catherine Ashton: 2014-01-01`
* Node 2: `Mohammad Javad: 2014-10-01`
* Node 3: `Iran: 2014-10-04`
* Node 4: `Cabient: 2014-10-05` (Note: Likely a typo for "Cabinet")
* (Ellipsis `...` indicates additional nodes not fully drawn)
* **Column O₂ (Iteration 2):**
* Node 1: `Catherine Ashton: 2014-01-01`
* Node 2: `Iran: 2014-11-04`
* Node 3: `China: 2014-10-30`
* Node 4: `John Kerry: 2014-11-05`
* Node 5: `John Kerry: 2014-10-28`
* (Ellipsis `...` indicates additional nodes)
* **Column O₃ (Iteration 3):**
* Node 1: `Oman: 2014-11-04`
* Node 2: `Oman: 2014-11-08`
* Node 3: `Iran: 2014-11-08`
* (Ellipsis `...` indicates additional nodes)
**Edge (Relationship) Inventory:**
* **From O₀ to O₁:**
* `Catherine Ashton` -> `Catherine Ashton: 2014-01-01` via `self`
* `Catherine Ashton` -> `Mohammad Javad: 2014-10-01` via `makeStatement`
* `Catherine Ashton` -> `Iran: 2014-10-04` via `hostVisit`
* `Catherine Ashton` -> `Cabient: 2014-10-05` via `consult`
* **From O₁ to O₂:**
* `Catherine Ashton: 2014-01-01` -> `Catherine Ashton: 2014-01-01` via `self`
* `Catherine Ashton: 2014-01-01` -> `Iran: 2014-11-04` via `expressIntentTo`
* `Mohammad Javad: 2014-10-01` -> `Iran: 2014-11-04` via `makeVisit`
* `Mohammad Javad: 2014-10-01` -> `China: 2014-10-30` via `hostVisit`
* `Iran: 2014-10-04` -> `China: 2014-10-30` via `expressIntentTo`
* `Cabient: 2014-10-05` -> `John Kerry: 2014-11-05` via `consult`
* `Cabient: 2014-10-05` -> `John Kerry: 2014-10-28` via `meetTo`
* **From O₂ to O₃:**
* `Catherine Ashton: 2014-01-01` -> `Oman: 2014-11-04` via `self`
* `Iran: 2014-11-04` -> `Oman: 2014-11-04` via `makeOptimisticComment`
* `China: 2014-10-30` -> `Oman: 2014-11-08` via `consult`
* `John Kerry: 2014-11-05` -> `Iran: 2014-11-08` via `makeVisit`
* `John Kerry: 2014-10-28` -> (An unlabeled orange node in O₃) via `makeVisit`
### Key Observations
1. **Temporal Progression:** The dates on the nodes generally progress from left to right (e.g., 2014-01-01 in O₁, 2014-10/11 in O₂, 2014-11-04/08 in O₃), indicating a timeline of events.
2. **Network Expansion:** The graph grows denser with each iteration. O₁ has 4 visible nodes, O₂ has 5, and O₃ has 3 visible nodes, but the ellipses suggest a much larger underlying network.
3. **Relationship Types:** The edge labels define a specific vocabulary of interactions: `self`, `makeStatement`, `hostVisit`, `consult`, `expressIntentTo`, `makeVisit`, `meetTo`, `makeOptimisticComment`.
4. **Entity Recurrence:** Certain entities appear multiple times with different dates (e.g., `John Kerry` on 2014-10-28 and 2014-11-05; `Iran` on 2014-10-04 and 2014-11-04), showing their involvement in multiple events.
5. **Potential Typo:** The node labeled "Cabient: 2014-10-05" is likely a misspelling of "Cabinet".
### Interpretation
This diagram is a visualization of a **temporal knowledge graph** or an **event sequence model**. It demonstrates a method for expanding a query about a central entity (Catherine Ashton) into a network of related events and actors over time.
* **What it represents:** The graph models diplomatic or political activities. The entities are primarily individuals (Catherine Ashton, Mohammad Javad, John Kerry) and countries (Iran, China, Oman). The relationships (`makeStatement`, `hostVisit`, `consult`, etc.) describe formal diplomatic actions.
* **How elements relate:** The iterations (O₁, O₂, O₃) likely represent steps in a graph traversal or reasoning algorithm. Starting from the query entity, the system discovers direct connections (Iteration 1), then uses those new nodes to discover second-order connections (Iteration 2), and so on. This builds a contextual web of events.
* **Purpose and Anomalies:** The purpose is to uncover indirect relationships and temporal patterns. For example, it shows how Catherine Ashton's actions in early 2014 are linked, through a chain of intermediaries, to events involving Oman and Iran in November 2014. The ellipses (`...`) are a critical component, indicating that the shown graph is a simplified excerpt from a much larger, more complex dataset. The diagram effectively illustrates how a single entity can be the root of a wide-reaching network of dated events.