## Network Diagram: Entity Relationships Over Iterations
### Overview
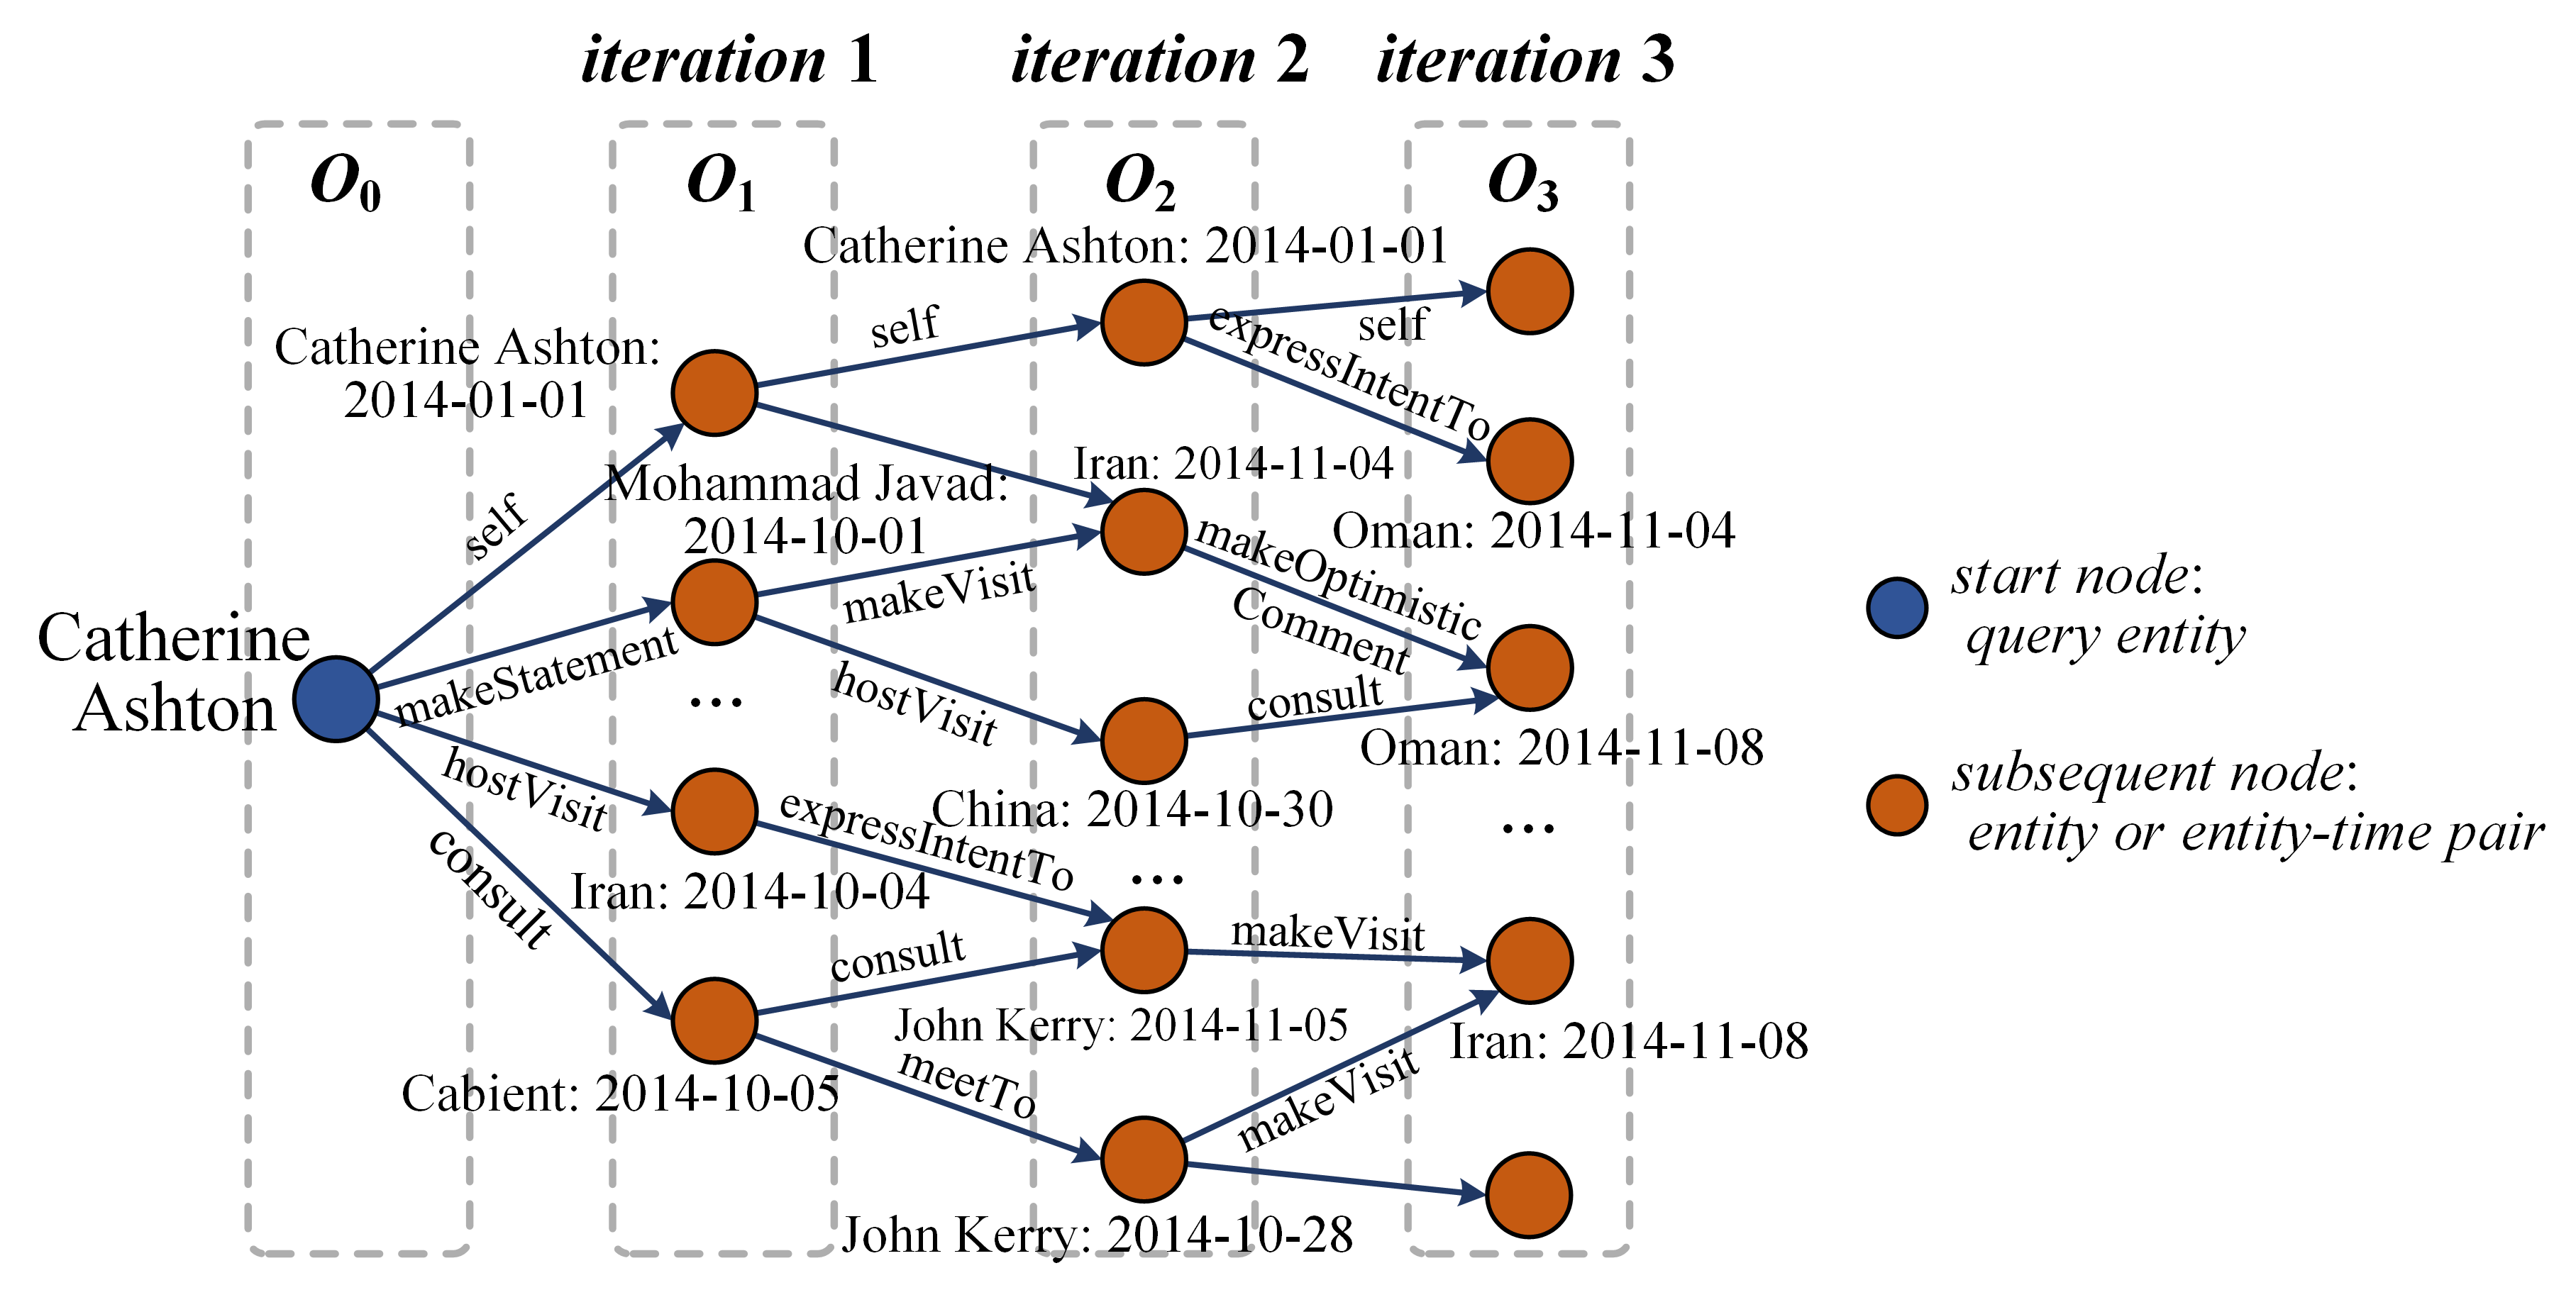
The diagram illustrates a dynamic network of entities and their interactions across four iterations (O₀ to O₃). It uses nodes (colored blue/orange) and directed edges (labeled with actions) to represent relationships between individuals, countries, and events. The start node is Catherine Ashton (blue), with subsequent nodes (orange) representing entities or entity-time pairs. Iterations are grouped in dashed boxes, showing temporal progression.
### Components/Axes
- **Nodes**:
- **Start Node**: Blue circle labeled "Catherine Ashton" (2014-01-01).
- **Subsequent Nodes**: Orange circles labeled with:
- Entities (e.g., "Mohammad Javad", "Iran", "Oman").
- Entity-time pairs (e.g., "Iran: 2014-11-04", "Oman: 2014-11-08").
- **Edges**:
- Directed arrows labeled with actions (e.g., "makeVisit", "expressIntentTo", "consult").
- Dates on edges indicate temporal context (e.g., "2014-10-01").
- **Iterations**:
- Labeled O₀ (initial state) to O₃ (final iteration), each containing nodes/edges specific to that phase.
- **Legend**:
- Blue: Start node (query entity).
- Orange: Subsequent nodes (entities or entity-time pairs).
### Detailed Analysis
#### Nodes and Labels
- **O₀**: Only the start node (Catherine Ashton) exists.
- **O₁**:
- Nodes: Mohammad Javad (2014-10-01), Iran (2014-10-04), China (2014-10-30).
- Edges: "makeStatement", "hostVisit", "consult".
- **O₂**:
- Nodes: Iran (2014-11-04), Oman (2014-11-04), John Kerry (2014-11-05).
- Edges: "expressIntentTo", "makeOptimisticComment", "meetTo".
- **O₃**:
- Nodes: Oman (2014-11-08), Iran (2014-11-08), John Kerry (2014-10-28).
- Edges: "makeVisit", "consult".
#### Edges and Actions
- **Key Actions**:
- "makeVisit": Connects Catherine Ashton to Iran (2014-10-01) and John Kerry (2014-10-28).
- "expressIntentTo": Links Iran (2014-11-04) to Oman (2014-11-04).
- "consult": Connects Catherine Ashton to China (2014-10-30) and John Kerry (2014-11-05).
#### Spatial Grounding
- **Legend**: Positioned on the right, clearly associating colors with node types.
- **Iteration Boxes**: Dashed gray boxes group nodes/edges by iteration (O₀ to O₃).
- **Node Placement**: Start node (Catherine Ashton) is at the bottom-left; subsequent nodes radiate outward in iterations.
### Key Observations
1. **Expanding Network**: Each iteration adds new nodes/edges, indicating growing complexity (e.g., O₃ has 3 nodes vs. O₀’s 1).
2. **Temporal Progression**: Dates on nodes/edges show sequential interactions (e.g., Iran’s involvement shifts from 2014-10-04 to 2014-11-04/08).
3. **Central Role of Catherine Ashton**: She is the sole start node, with all edges originating from her.
4. **Entity-Time Pairs**: Nodes like "Iran: 2014-11-04" suggest context-specific interactions.
### Interpretation
This diagram likely models a **knowledge graph** or **event timeline** for diplomatic or organizational activities. The start node (Catherine Ashton) acts as the origin of interactions, with subsequent nodes representing entities or time-bound events. The use of entity-time pairs (e.g., "Oman: 2014-11-08") implies that relationships are context-dependent on specific dates. The iterative structure (O₀–O₃) suggests a phased analysis, possibly tracking the evolution of collaborations or conflicts. The centrality of Catherine Ashton highlights her role as a key actor, while the diversity of actions ("makeVisit", "consult") indicates multifaceted engagements. The diagram emphasizes **temporal causality**, as edges with dates may represent sequential dependencies (e.g., "expressIntentTo" preceding "makeVisit").