## Scatter Plot: Batch Size Scan
### Overview
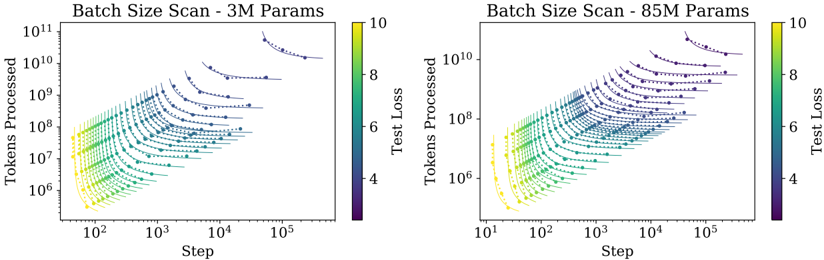
The image contains two scatter plots comparing the number of tokens processed against the training step for different batch sizes. The left plot represents a model with 3 million parameters, while the right plot represents a model with 85 million parameters. Each data point is colored according to the test loss, with a color gradient from purple (low) to yellow (high).
### Components/Axes
* **Titles:**
* Left Plot: "Batch Size Scan - 3M Params"
* Right Plot: "Batch Size Scan - 85M Params"
* **X-axis (both plots):**
* Label: "Step"
* Scale: Logarithmic, ranging from approximately 10^1 to 10^5.
* **Y-axis (both plots):**
* Label: "Tokens Processed"
* Scale: Logarithmic, ranging from 10^6 to 10^11.
* **Colorbar (both plots):**
* Label: "Test Loss"
* Scale: Linear, ranging from 4 (purple) to 10 (yellow).
### Detailed Analysis
**Left Plot (3M Params):**
* Each line represents a different batch size.
* The lines generally slope upwards, indicating that as the step increases, the number of tokens processed also increases.
* The lines are colored based on the test loss, with the lower lines (smaller batch sizes) tending to be yellow (higher loss) and the upper lines (larger batch sizes) tending to be purple/blue (lower loss).
* **Data Points (Examples):**
* At Step = 10^2, Tokens Processed ranges from approximately 10^6 (yellow, Test Loss ~ 10) to 10^7 (blue, Test Loss ~ 6).
* At Step = 10^4, Tokens Processed ranges from approximately 10^8 (yellow, Test Loss ~ 10) to 10^10 (blue, Test Loss ~ 4).
**Right Plot (85M Params):**
* Similar to the left plot, each line represents a different batch size.
* The lines also slope upwards, indicating that as the step increases, the number of tokens processed increases.
* The lines are colored based on the test loss, with the lower lines (smaller batch sizes) tending to be yellow (higher loss) and the upper lines (larger batch sizes) tending to be purple/blue (lower loss).
* **Data Points (Examples):**
* At Step = 10^2, Tokens Processed ranges from approximately 10^6 (yellow, Test Loss ~ 10) to 10^7 (green, Test Loss ~ 8).
* At Step = 10^4, Tokens Processed ranges from approximately 10^8 (yellow, Test Loss ~ 10) to 10^10 (blue, Test Loss ~ 4).
### Key Observations
* Both plots show a clear relationship between the number of tokens processed, the training step, and the test loss.
* Larger batch sizes (higher lines) generally result in lower test loss (purple/blue colors).
* As the training step increases, the number of tokens processed increases for all batch sizes.
* The range of tokens processed is similar for both the 3M and 85M parameter models.
### Interpretation
The plots demonstrate the impact of batch size on the training process and the resulting test loss. The data suggests that using larger batch sizes leads to lower test loss, indicating better model performance. This could be due to more stable gradient updates or better exploration of the loss landscape. The plots also show that increasing the number of training steps leads to more tokens processed, as expected. The similarity in the range of tokens processed between the 3M and 85M parameter models suggests that the model size does not significantly affect the number of tokens processed for a given batch size and training step.