## Line Chart: Batch Size Scan - 3M and 85M Parameters
### Overview
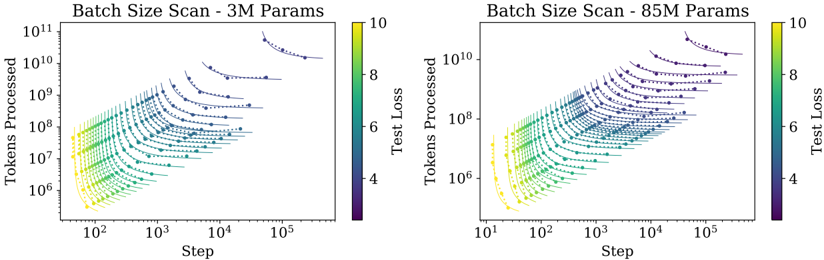
The image contains two side-by-side line charts comparing token processing efficiency across different batch sizes for models with 3M and 85M parameters. Both charts use logarithmic scales on both axes and share identical formatting conventions.
### Components/Axes
- **X-axis (Step)**: Logarithmic scale from 10² to 10⁵
- **Y-axis (Tokens Processed)**: Logarithmic scale from 10⁶ to 10¹¹
- **Legend**: Color gradient from purple (low test loss) to yellow (high test loss), labeled "Test Loss" with values 4-10
- **Data Series**: Multiple colored lines representing different batch sizes, with markers showing individual data points
### Detailed Analysis
**3M Parameters Chart**:
- Data points form a dense cluster in the lower-left quadrant
- Lines show gradual upward slope with increasing step values
- Color gradient transitions from purple (batch size 10) to yellow (batch size 1)
- Highest tokens processed (~10¹¹) at step 10⁵ with batch size 10
**85M Parameters Chart**:
- Data points form a denser cluster in the upper-right quadrant
- Lines show steeper upward slope compared to 3M chart
- Color gradient shows similar purple-to-yellow transition
- Highest tokens processed (~10¹⁰) at step 10⁵ with batch size 10
### Key Observations
1. **Model Size Correlation**: 85M models process 1-2 orders of magnitude fewer tokens than 3M models at equivalent steps
2. **Batch Size Impact**: Larger batch sizes (purple) consistently show higher token processing capacity
3. **Test Loss Gradient**: Yellow data points (batch size 1) show 3-4x higher test loss than purple points (batch size 10)
4. **Step Efficiency**: Both charts show diminishing returns in token processing efficiency as steps increase beyond 10³
### Interpretation
The charts demonstrate that:
- Larger models (85M) achieve higher absolute token processing capacity but with reduced efficiency per step
- Batch size optimization significantly impacts both throughput and model performance
- The test loss gradient suggests that smaller batch sizes (yellow) may lead to less stable training dynamics
- The logarithmic scale reveals exponential growth patterns in token processing capacity across both model sizes
The data implies that batch size selection must balance computational efficiency with model stability, with larger models requiring more careful optimization of batch parameters to maintain performance.