## Line Chart: Success Rate vs. Number of Actions
### Overview
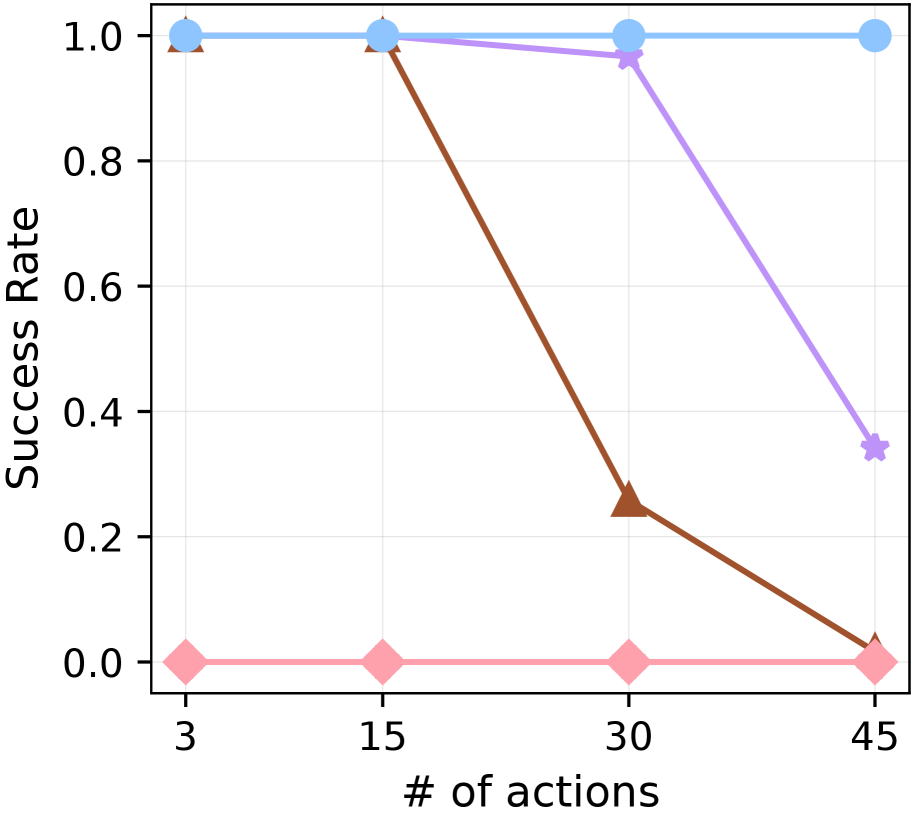
The image is a line chart comparing the success rate of different methods (represented by different colored lines) against the number of actions taken. The x-axis represents the number of actions, and the y-axis represents the success rate.
### Components/Axes
* **X-axis:** "# of actions" with markers at 3, 15, 30, and 45.
* **Y-axis:** "Success Rate" with markers at 0.0, 0.2, 0.4, 0.6, 0.8, and 1.0.
* **Data Series:**
* Light Blue line with circle markers.
* Brown line with triangle markers.
* Light Purple line with star markers.
* Light Pink line with diamond markers.
### Detailed Analysis
* **Light Blue Line (Circle Markers):** This line remains constant at a success rate of approximately 1.0 across all numbers of actions (3, 15, 30, and 45).
* (3, 1.0)
* (15, 1.0)
* (30, 1.0)
* (45, 1.0)
* **Brown Line (Triangle Markers):** This line starts at a success rate of approximately 1.0 at 3 actions, then decreases to approximately 0.25 at 30 actions, and further decreases to approximately 0.0 at 45 actions.
* (3, 1.0)
* (15, 1.0)
* (30, 0.25)
* (45, 0.0)
* **Light Purple Line (Star Markers):** This line remains constant at a success rate of approximately 1.0 for 3 and 15 actions, then decreases to approximately 0.95 at 30 actions, and further decreases to approximately 0.35 at 45 actions.
* (3, 1.0)
* (15, 1.0)
* (30, 0.95)
* (45, 0.35)
* **Light Pink Line (Diamond Markers):** This line remains constant at a success rate of approximately 0.0 across all numbers of actions (3, 15, 30, and 45).
* (3, 0.0)
* (15, 0.0)
* (30, 0.0)
* (45, 0.0)
### Key Observations
* The light blue method maintains a perfect success rate regardless of the number of actions.
* The brown method's success rate decreases significantly as the number of actions increases.
* The light purple method's success rate also decreases as the number of actions increases, but not as drastically as the brown method.
* The light pink method consistently fails, with a success rate of 0.0 regardless of the number of actions.
### Interpretation
The chart compares the performance of four different methods based on their success rate as the number of actions increases. The light blue method is the most robust, maintaining a perfect success rate. The brown and light purple methods are sensitive to the number of actions, with their success rates decreasing as the number of actions increases. The light pink method is consistently unsuccessful. This suggests that the light blue method is the most reliable, while the brown and light purple methods may require further optimization or are only suitable for tasks requiring fewer actions. The light pink method is ineffective and should not be used.