\n
## Line Chart: Success Rate vs. Number of Actions
### Overview
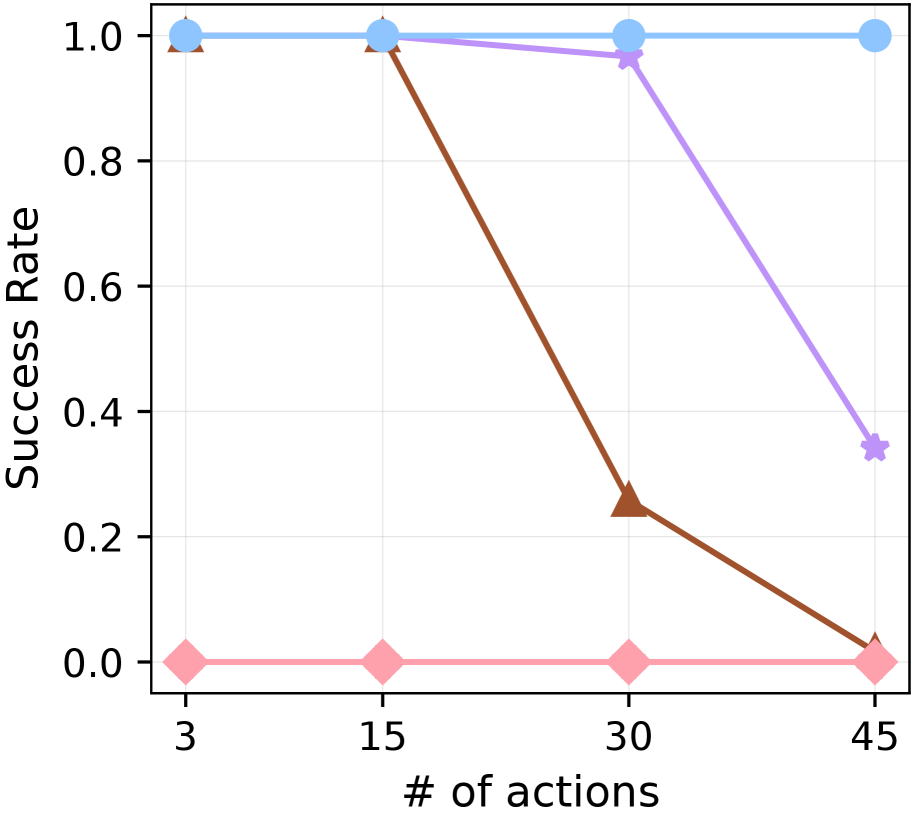
This image presents a line chart illustrating the relationship between the number of actions performed and the resulting success rate. Two distinct data series are plotted, showing how success rate changes with an increasing number of actions. The chart uses a grid background for easier readability.
### Components/Axes
* **X-axis Title:** "# of actions"
* **X-axis Markers:** 3, 15, 30, 45
* **Y-axis Title:** "Success Rate"
* **Y-axis Scale:** 0.0 to 1.0 (approximately)
* **Data Series 1 (Blue Line):** Represents a relatively stable success rate.
* **Data Series 2 (Brown Line):** Represents a rapidly decreasing success rate.
* **Data Points:** Represented by circular markers.
### Detailed Analysis
**Data Series 1 (Blue Line):**
The blue line starts at approximately 0.98 at 3 actions. It remains relatively constant until 15 actions, where it is approximately 0.96. At 30 actions, the success rate is approximately 0.94. Finally, at 45 actions, the success rate drops to approximately 0.38. The trend is generally downward, but with a slow rate of decline until the final data point.
**Data Series 2 (Brown Line):**
The brown line begins at approximately 0.02 at 3 actions. It increases slightly to approximately 0.04 at 15 actions. At 30 actions, the success rate drops significantly to approximately 0.24. Finally, at 45 actions, the success rate remains at approximately 0.02. The trend is initially slightly upward, then a steep decline.
### Key Observations
* The success rate for the blue line remains high for the majority of the actions, only dropping significantly at 45 actions.
* The success rate for the brown line is consistently low, and experiences a dramatic decrease between 15 and 30 actions.
* The brown line's success rate is nearly zero for both the initial and final number of actions (3 and 45).
* The two lines diverge significantly as the number of actions increases.
### Interpretation
The chart suggests that increasing the number of actions has a differential impact on success rates depending on the data series. The blue line indicates that a process can maintain a high success rate even with a moderate increase in the number of actions, but experiences a significant drop-off at a higher number of actions (45). The brown line suggests that the process is inherently unreliable, with a low success rate that deteriorates rapidly as the number of actions increases. This could indicate a limitation in the process's scalability or robustness. The steep decline in the brown line between 15 and 30 actions might represent a critical threshold where the process becomes unsustainable. The data could be used to identify areas for improvement in the process represented by the brown line, or to understand the limitations of the process represented by the blue line.