\n
## Line Chart: Accuracy vs. Thinking Compute
### Overview
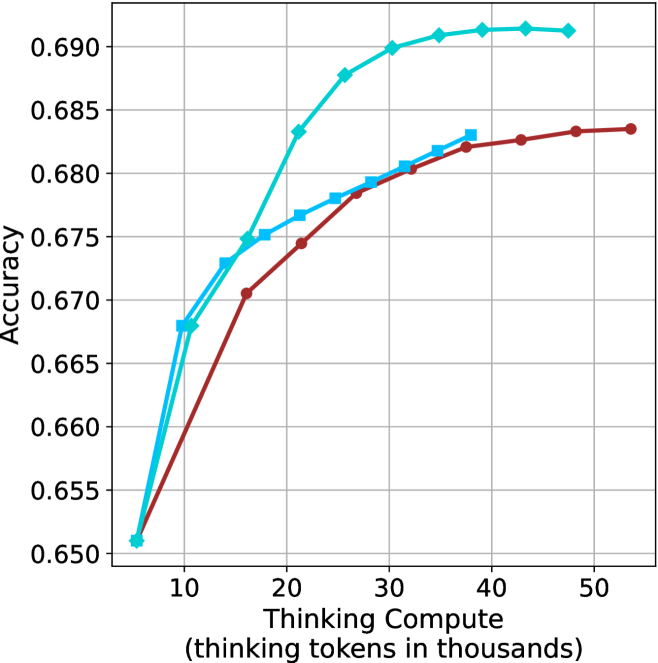
The image is a line chart plotting "Accuracy" against "Thinking Compute." It displays two distinct data series, showing how accuracy changes as the amount of thinking compute (measured in thousands of tokens) increases. Both series demonstrate a positive correlation, with accuracy rising sharply at lower compute levels before exhibiting diminishing returns.
### Components/Axes
* **X-Axis (Horizontal):**
* **Label:** "Thinking Compute (thinking tokens in thousands)"
* **Scale:** Linear scale with major tick marks and grid lines at 10, 20, 30, 40, and 50. The axis starts at approximately 5.
* **Y-Axis (Vertical):**
* **Label:** "Accuracy"
* **Scale:** Linear scale with major tick marks and grid lines at 0.650, 0.655, 0.660, 0.665, 0.670, 0.675, 0.680, 0.685, and 0.690.
* **Data Series:**
1. **Cyan Line with Diamond Markers:** Positioned as the upper line for most of the chart.
2. **Brown Line with Circle Markers:** Positioned as the lower line for most of the chart.
* **Legend:** No explicit legend is present within the chart area. The series are distinguished solely by color and marker shape.
* **Grid:** A light gray grid is present, aligned with the major ticks on both axes.
### Detailed Analysis
**Data Series 1: Cyan Line (Diamond Markers)**
* **Trend:** The line shows a steep, concave-downward increase. It rises rapidly from low compute, begins to decelerate around 20-30k tokens, and plateaus near the top of the chart.
* **Approximate Data Points:**
* (~5, 0.651)
* (~10, 0.668)
* (~15, 0.675)
* (~20, 0.683)
* (~25, 0.688)
* (~30, 0.690)
* (~35, 0.691)
* (~40, 0.691)
* (~45, 0.691)
* (~50, 0.691)
**Data Series 2: Brown Line (Circle Markers)**
* **Trend:** The line also shows a concave-downward increase but with a consistently lower slope than the cyan line. It rises steadily and continues a gradual ascent even at higher compute levels, without a clear plateau within the plotted range.
* **Approximate Data Points:**
* (~5, 0.651) *[Starts at the same point as the cyan line]*
* (~15, 0.671)
* (~20, 0.675)
* (~25, 0.678)
* (~30, 0.680)
* (~35, 0.682)
* (~40, 0.683)
* (~45, 0.684)
* (~50, 0.684)
### Key Observations
1. **Performance Gap:** A clear performance gap emerges immediately after the first data point. The cyan series consistently achieves higher accuracy than the brown series for the same amount of thinking compute beyond ~5k tokens.
2. **Diminishing Returns:** Both series exhibit diminishing returns. The cyan series' gains become negligible after approximately 30k thinking tokens, while the brown series' gains slow but do not fully plateau.
3. **Convergence at Origin:** Both lines appear to originate from the same point at the lowest compute value (~5k tokens, ~0.651 accuracy), suggesting a common baseline performance.
4. **Slope Comparison:** The cyan line has a steeper initial slope, indicating it translates additional compute into accuracy gains more efficiently in the low-to-mid compute range (5k-25k tokens).
### Interpretation
This chart likely compares the scaling efficiency of two different models, algorithms, or prompting strategies (represented by the cyan and brown lines) as a function of allocated "thinking" compute. The data suggests that the method represented by the **cyan line is significantly more compute-efficient**, achieving higher accuracy with fewer resources and reaching a performance ceiling (around 0.691 accuracy) that the brown method does not approach within the tested range.
The brown line's continued, albeit slow, ascent suggests it may eventually reach similar accuracy levels but would require substantially more compute, making it less efficient. The shared starting point implies that for very simple tasks requiring minimal thinking (low compute), the methods perform identically. The divergence highlights how architectural or procedural differences become critical as task complexity (and required compute) increases. The plateau of the cyan line could indicate a fundamental limit of that approach or the task's inherent difficulty.