## Contour Plot: General Text vs. Medical Text
### Overview
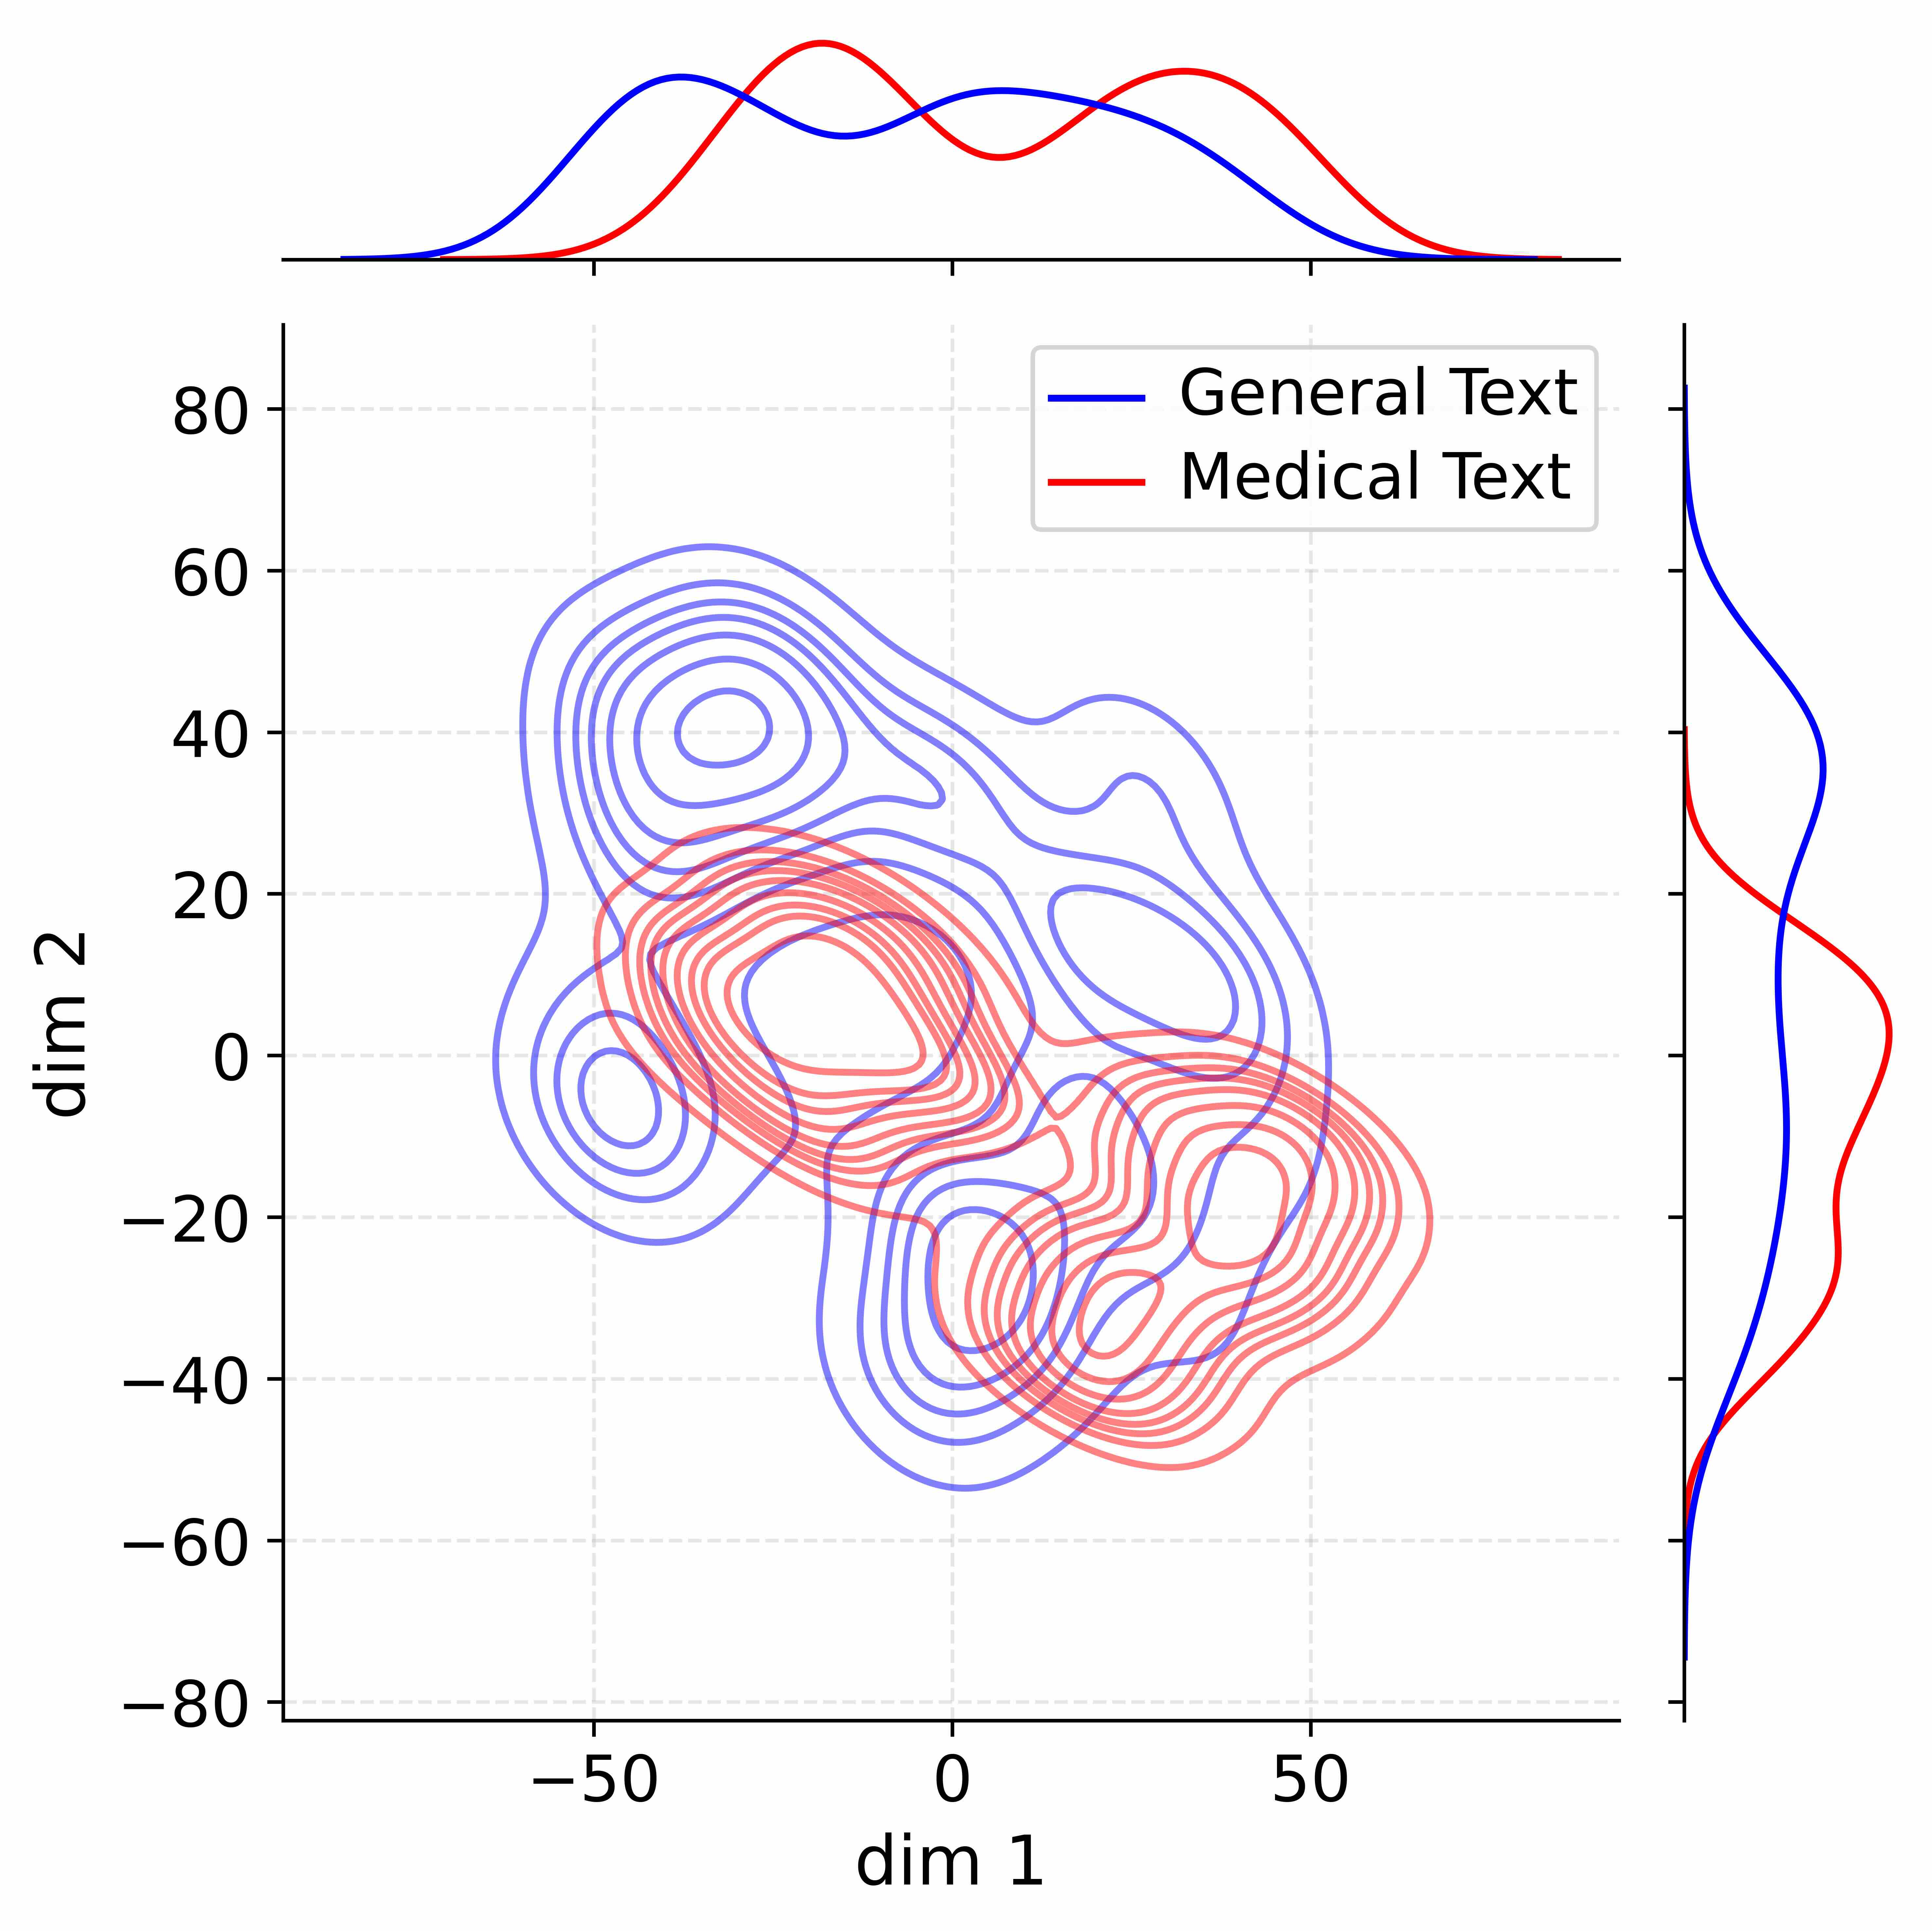
The image is a contour plot comparing the distribution of "General Text" and "Medical Text" across two dimensions (dim 1 and dim 2). The plot includes marginal density plots along the top and right edges, showing the distribution of each text type along each individual dimension.
### Components/Axes
* **Main Plot:** A 2D contour plot showing the density distribution of "General Text" (blue) and "Medical Text" (red).
* X-axis (dim 1): Ranges from -50 to 50.
* Y-axis (dim 2): Ranges from -80 to 80.
* Gridlines: Light gray dashed lines.
* **Top Marginal Plot:** Density plot showing the distribution of "General Text" (blue) and "Medical Text" (red) along dim 1.
* **Right Marginal Plot:** Density plot showing the distribution of "General Text" (blue) and "Medical Text" (red) along dim 2.
* **Legend:** Located in the top-center of the plot.
* "General Text" - Blue line
* "Medical Text" - Red line
### Detailed Analysis or ### Content Details
**Main Plot:**
* **General Text (Blue):**
* The highest density area is centered around dim 1 = -50 and dim 2 = 40.
* The contours suggest a cluster of data points in the upper-left quadrant.
* **Medical Text (Red):**
* The highest density area is centered around dim 1 = 40 and dim 2 = -20.
* The contours suggest a cluster of data points in the lower-right quadrant.
* There is some overlap between the "General Text" and "Medical Text" distributions, particularly around the center of the plot.
**Top Marginal Plot (dim 1):**
* **General Text (Blue):**
* The distribution peaks around dim 1 = -50.
* The distribution has a smaller peak around dim 1 = 20.
* **Medical Text (Red):**
* The distribution peaks around dim 1 = 40.
* The distribution has a smaller peak around dim 1 = -10.
**Right Marginal Plot (dim 2):**
* **General Text (Blue):**
* The distribution peaks around dim 2 = 60.
* **Medical Text (Red):**
* The distribution peaks around dim 2 = -20.
### Key Observations
* "General Text" is primarily concentrated in the upper-left quadrant, while "Medical Text" is concentrated in the lower-right quadrant.
* The marginal distributions confirm that "General Text" tends to have higher values along dim 2 and lower values along dim 1, while "Medical Text" tends to have lower values along dim 2 and higher values along dim 1.
* There is some overlap between the two distributions, indicating that some data points share similar values along both dimensions.
### Interpretation
The contour plot visualizes the differences in the distribution of "General Text" and "Medical Text" across two dimensions. The separation of the two clusters suggests that these dimensions are useful for distinguishing between the two types of text. The marginal distributions provide further insight into the characteristics of each text type along each individual dimension. The overlap between the distributions indicates that the separation is not perfect, and some data points may be misclassified if only these two dimensions are considered.