## Scatter Plot with Contour Density: Text Type Distribution
### Overview
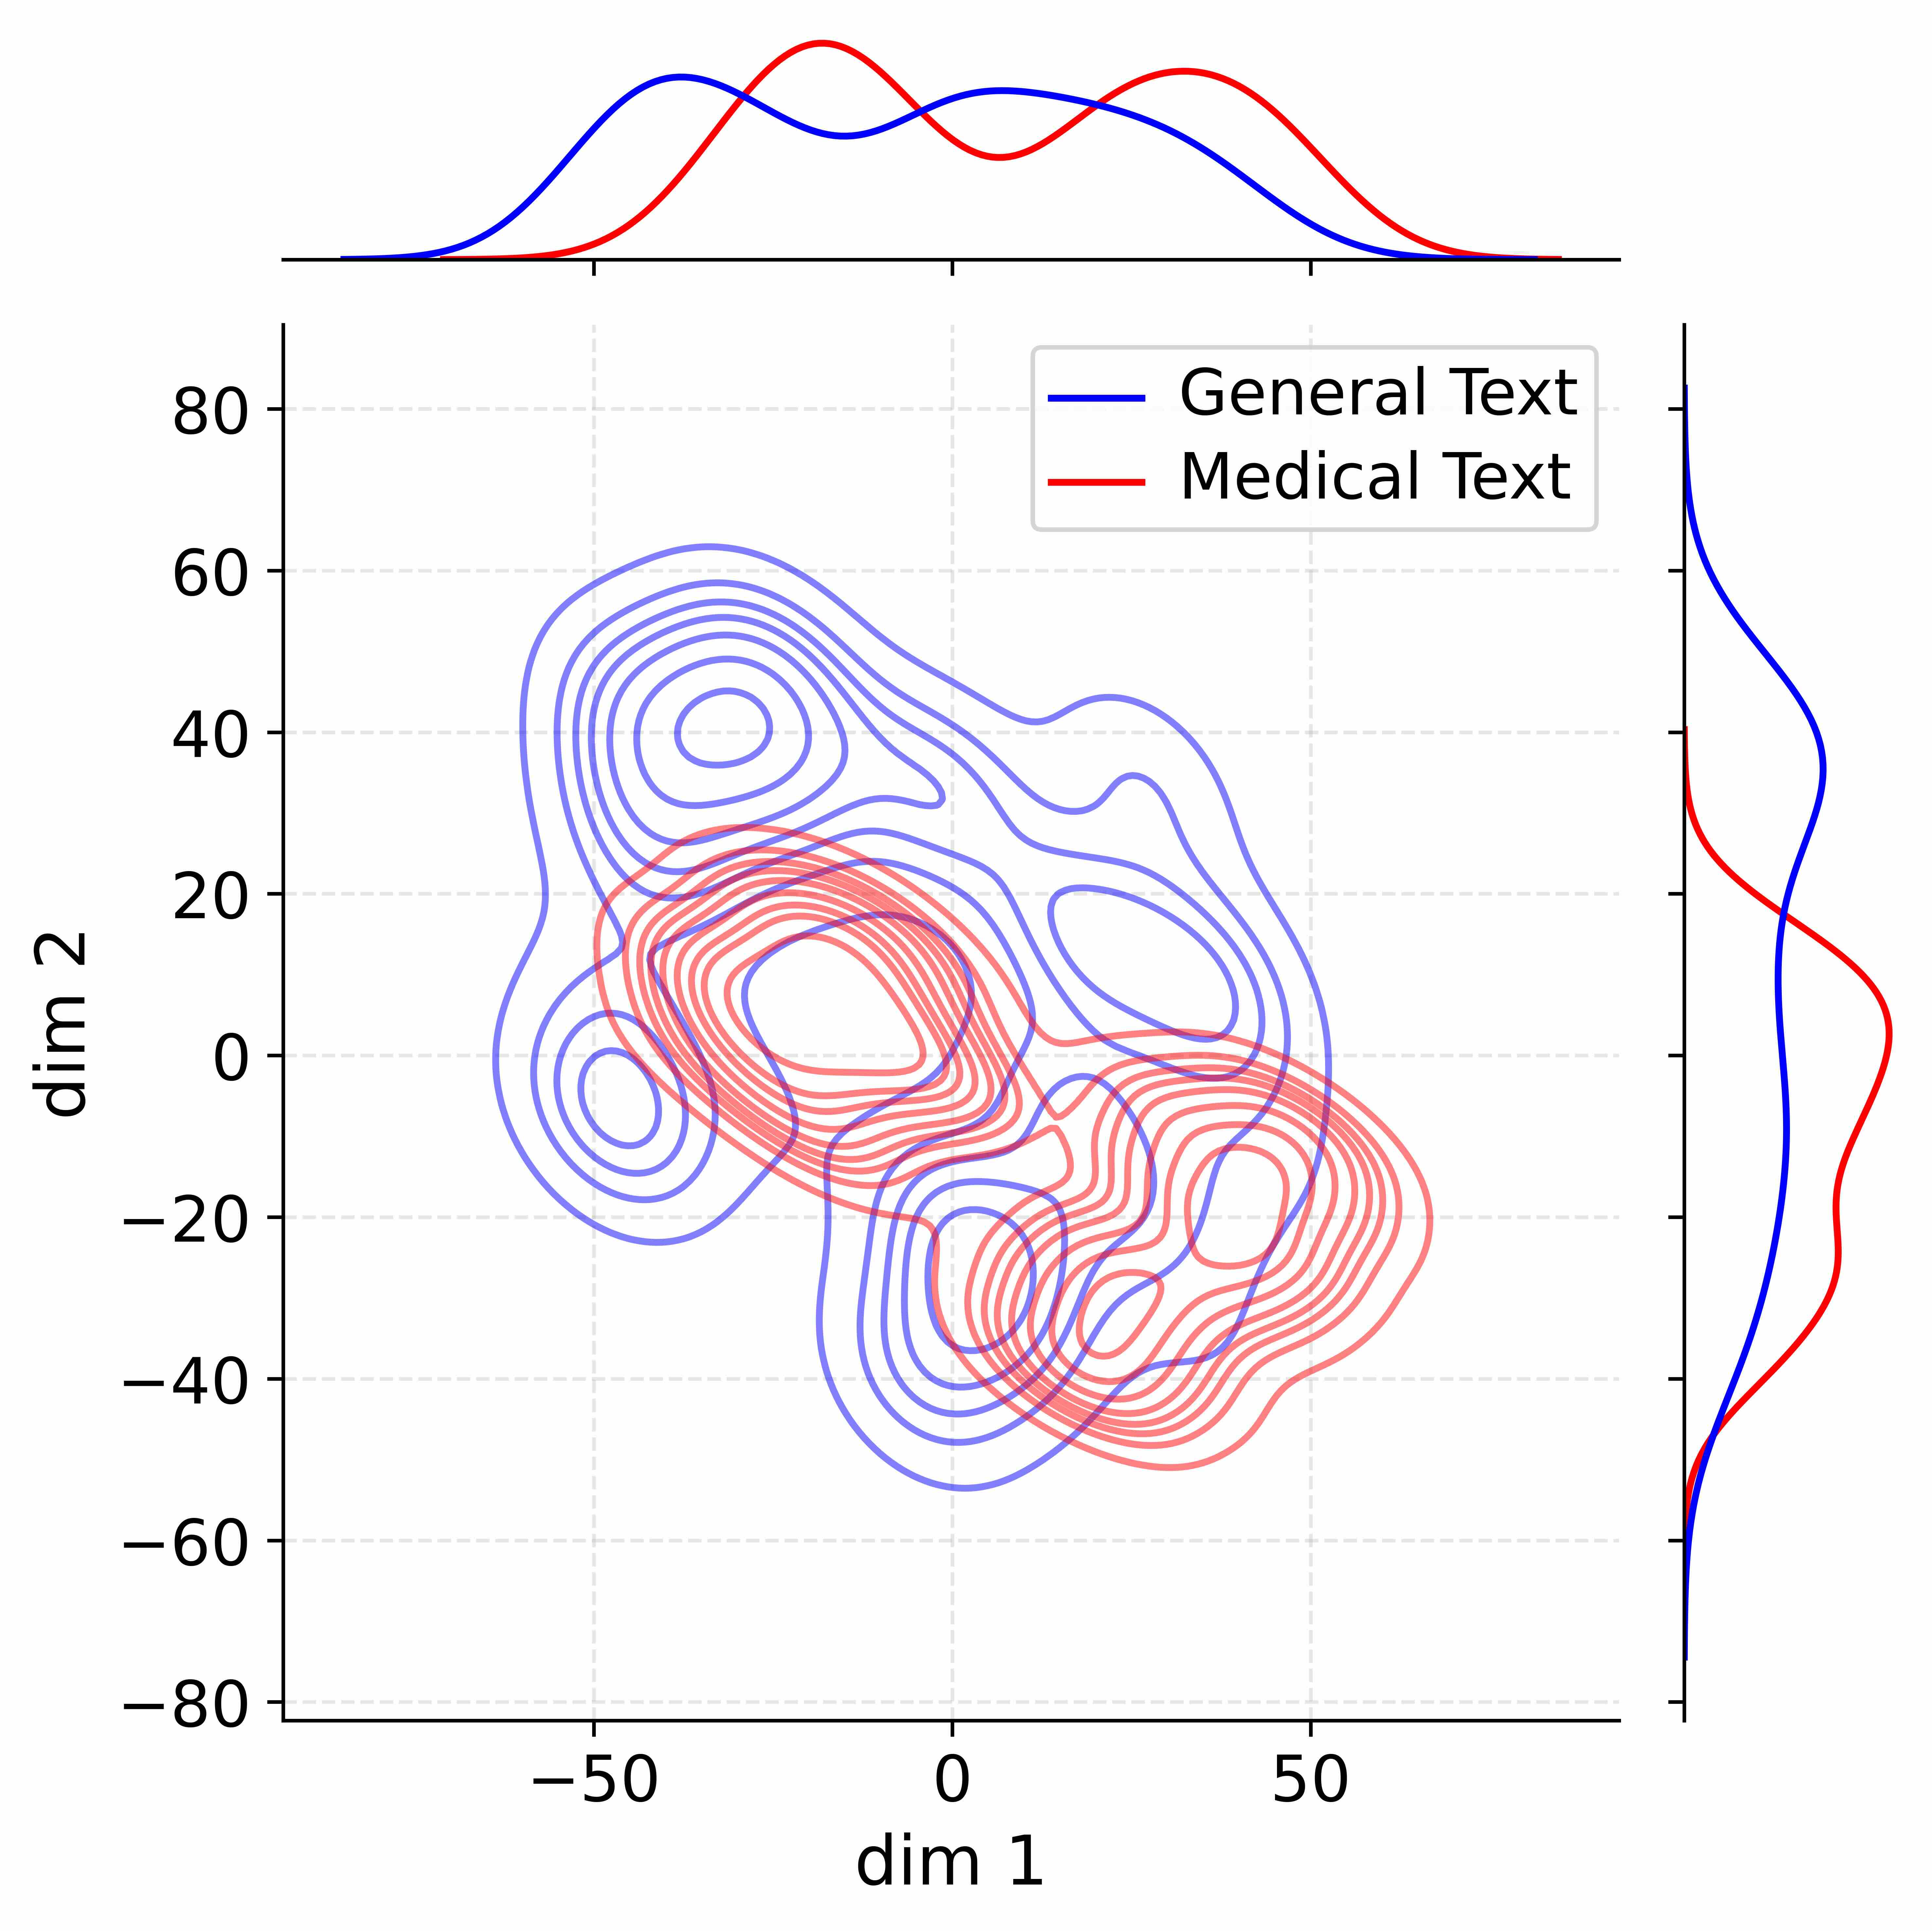
The image presents a 2D scatter plot with contour density overlays, comparing the distribution of two text types: "General Text" (blue) and "Medical Text" (red). Marginal histograms on the top and right edges show the univariate distributions of dimensions 1 and 2. The plot reveals clustering patterns and dimensional relationships between the two categories.
### Components/Axes
- **Axes**:
- X-axis: `dim 1` (ranges from -80 to 80)
- Y-axis: `dim 2` (ranges from -80 to 80)
- **Legend**:
- Top-right corner:
- Blue line: "General Text"
- Red line: "Medical Text"
- **Marginal Histograms**:
- Top histogram: Distribution of `dim 1` values
- Right histogram: Distribution of `dim 2` values
### Detailed Analysis
1. **Contour Density**:
- **General Text (Blue)**:
- Concentrated in a large, irregular cluster centered near `dim 1 = 0` and `dim 2 = 20`.
- Secondary cluster near `dim 1 = -20` and `dim 2 = -40`.
- Density decreases sharply beyond `dim 1 = ±50` and `dim 2 = ±60`.
- **Medical Text (Red)**:
- Dominant cluster near `dim 1 = 0` and `dim 2 = -20`.
- Smaller cluster near `dim 1 = 20` and `dim 2 = 0`.
- Density diminishes beyond `dim 1 = ±40` and `dim 2 = ±40`.
2. **Marginal Histograms**:
- **`dim 1` (Top)**:
- General Text peaks near `dim 1 = 0` (height ~40).
- Medical Text peaks near `dim 1 = 0` (height ~30).
- Both show bimodal distributions with secondary peaks at `dim 1 = ±20`.
- **`dim 2` (Right)**:
- General Text peaks near `dim 2 = 20` (height ~50).
- Medical Text peaks near `dim 2 = -20` (height ~40).
- Both exhibit long tails extending to `dim 2 = ±80`.
3. **Overlap Region**:
- Significant overlap occurs between `dim 1 = -10` to `10` and `dim 2 = -10` to `10`, suggesting shared characteristics in this subspace.
### Key Observations
- **Dimensional Separation**:
- General Text clusters in the upper-right quadrant (`dim 2 > 0`), while Medical Text clusters in the lower-left quadrant (`dim 2 < 0`).
- **Dimensional Spread**:
- `dim 1` shows broader variability for both categories compared to `dim 2`.
- **Anomalies**:
- A small red (Medical Text) cluster near `dim 1 = 20, dim 2 = 0` deviates from the main cluster, potentially indicating outliers.
### Interpretation
The data suggests that General Text and Medical Text occupy distinct but overlapping regions in the 2D subspace. The marginal histograms reveal that `dim 1` is more dispersed, while `dim 2` drives the primary separation between categories. The overlap in the central region (`dim 1 = ±10, dim 2 = ±10`) implies shared features (e.g., linguistic patterns) between the two text types. The bimodal distributions in `dim 1` for both categories may reflect subcategories (e.g., formal vs. informal text). The outlier in Medical Text near `dim 1 = 20` warrants further investigation for potential misclassification or unique characteristics.