## Horizontal Bar Chart: Model Performance Comparison
### Overview
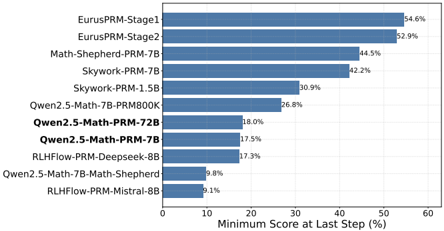
The image is a horizontal bar chart comparing the performance of various language models based on their "Minimum Score at Last Step (%)". The models are listed on the y-axis, and the corresponding scores are represented by the length of the horizontal bars. The chart provides a visual ranking of the models' performance.
### Components/Axes
* **Y-axis (Vertical):** Lists the names of the language models.
* EurusPRM-Stage1
* EurusPRM-Stage2
* Math-Shepherd-PRM-7B
* Skywork-PRM-7B
* Skywork-PRM-1.5B
* Qwen2.5-Math-7B-PRM800K
* **Qwen2.5-Math-PRM-72B** (Bolded)
* **Qwen2.5-Math-PRM-7B** (Bolded)
* RLHFlow-PRM-Deepseek-8B
* Qwen2.5-Math-7B-Math-Shepherd
* RLHFlow-PRM-Mistral-8B
* **X-axis (Horizontal):** Represents the "Minimum Score at Last Step (%)". The scale ranges from 0% to 60% with increments of 10%.
* 0
* 10
* 20
* 30
* 40
* 50
* 60
* Label: Minimum Score at Last Step (%)
* **Bars:** Each bar represents a model's score. All bars are the same color: a shade of blue.
### Detailed Analysis
The following table lists the models and their corresponding scores, as read from the bar chart:
| Model | Minimum Score at Last Step (%) |
| ------------------------------ | ------------------------------ |
| EurusPRM-Stage1 | 54.6% |
| EurusPRM-Stage2 | 52.9% |
| Math-Shepherd-PRM-7B | 44.5% |
| Skywork-PRM-7B | 42.2% |
| Skywork-PRM-1.5B | 30.9% |
| Qwen2.5-Math-7B-PRM800K | 26.8% |
| **Qwen2.5-Math-PRM-72B** | 18.0% |
| **Qwen2.5-Math-PRM-7B** | 17.5% |
| RLHFlow-PRM-Deepseek-8B | 17.3% |
| Qwen2.5-Math-7B-Math-Shepherd | 9.8% |
| RLHFlow-PRM-Mistral-8B | 9.1% |
### Key Observations
* EurusPRM-Stage1 has the highest minimum score at the last step, at 54.6%.
* RLHFlow-PRM-Mistral-8B has the lowest minimum score at the last step, at 9.1%.
* The scores vary significantly across the different models, indicating a wide range of performance.
* The two Qwen models that are bolded, Qwen2.5-Math-PRM-72B and Qwen2.5-Math-PRM-7B, have relatively low scores compared to the top performers.
### Interpretation
The bar chart provides a clear comparison of the performance of different language models based on the "Minimum Score at Last Step (%)" metric. The data suggests that the EurusPRM models outperform the other models listed. The Qwen2.5 models, particularly the 72B and 7B versions, show relatively weaker performance compared to the top-performing models. The chart highlights the variability in performance across different model architectures and configurations.