\n
## Bar Chart: Minimum Score at Last Step (%) for Different Models
### Overview
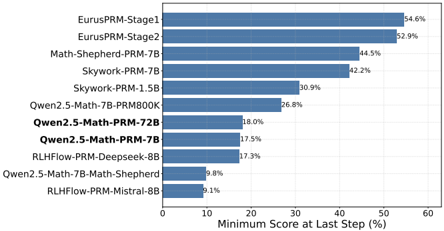
This is a horizontal bar chart comparing the "Minimum Score at Last Step (%)" achieved by various models. The models are listed on the vertical axis, and the percentage score is represented by the length of the horizontal bars on the horizontal axis.
### Components/Axes
* **X-axis Title:** "Minimum Score at Last Step (%)" - Scale ranges from 0 to 60, with tick marks at 10, 20, 30, 40, 50, and 60.
* **Y-axis:** Lists the following models (from top to bottom):
* EurusPRM-Stage1
* EurusPRM-Stage2
* Math-Shepherd-PRM-7B
* Skywork-PRM-7B
* Skywork-PRM-1.5B
* Qwen2.5-Math-7B-PRMBOOK
* Qwen2.5-Math-PRM-72B
* Qwen2.5-Math-PRM-7B
* RLHFlow-Deepseek-8B
* Qwen2.5-Math-7B-Shepherd
* RLHFlow-PRM-Mistral-8B
* **Color:** All bars are a uniform shade of blue.
### Detailed Analysis
The bars represent the minimum score at the last step, expressed as a percentage. The trend is generally downward as we move down the list of models.
* **EurusPRM-Stage1:** Approximately 54.6%
* **EurusPRM-Stage2:** Approximately 52.2%
* **Math-Shepherd-PRM-7B:** Approximately 44.5%
* **Skywork-PRM-7B:** Approximately 42.2%
* **Skywork-PRM-1.5B:** Approximately 39.9%
* **Qwen2.5-Math-7B-PRMBOOK:** Approximately 26.8%
* **Qwen2.5-Math-PRM-72B:** Approximately 18.0%
* **Qwen2.5-Math-PRM-7B:** Approximately 17.5%
* **RLHFlow-Deepseek-8B:** Approximately 17.3%
* **Qwen2.5-Math-7B-Shepherd:** Approximately 9.8%
* **RLHFlow-PRM-Mistral-8B:** Approximately 9.1%
### Key Observations
* EurusPRM-Stage1 has the highest minimum score at the last step, significantly outperforming all other models.
* RLHFlow-PRM-Mistral-8B and Qwen2.5-Math-7B-Shepherd have the lowest minimum scores.
* There is a noticeable gap in performance between the top two models (EurusPRM-Stage1 and EurusPRM-Stage2) and the rest.
* The Qwen2.5 models generally perform lower than the EurusPRM and Skywork models.
### Interpretation
The chart demonstrates a clear ranking of the models based on their minimum score at the last step. This metric likely represents the lowest performance observed during the evaluation process, potentially indicating robustness or consistency. The significant difference in scores suggests that some models are considerably more reliable or accurate than others. The two EurusPRM models stand out as particularly strong performers. The lower scores of the Qwen2.5 models and RLHFlow-PRM-Mistral-8B might indicate areas for improvement in their training or architecture. The chart provides a valuable comparative assessment of these models, which could inform decisions about which models to deploy for specific tasks. The data suggests that the "last step" is a critical point in the model's performance, and optimizing for this stage could lead to overall improvements.