## Horizontal Bar Chart: Minimum Score at Last Step (%) by AI Model
### Overview
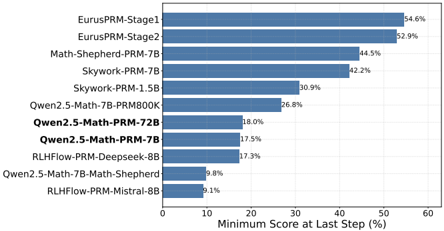
The image displays a horizontal bar chart comparing the performance of various AI models based on a metric called "Minimum Score at Last Step (%)". The chart ranks models from highest to lowest score, with the model names listed on the vertical axis (y-axis) and the percentage score on the horizontal axis (x-axis).
### Components/Axes
* **Chart Type:** Horizontal Bar Chart.
* **Y-Axis (Vertical):** Lists the names of 11 different AI models. The labels are left-aligned.
* **X-Axis (Horizontal):** Labeled "Minimum Score at Last Step (%)". The scale runs from 0 to 60, with major tick marks at intervals of 10 (0, 10, 20, 30, 40, 50, 60).
* **Data Series:** A single data series represented by solid blue horizontal bars. Each bar's length corresponds to the model's score.
* **Data Labels:** The exact percentage value is printed at the end of each bar, to the right.
* **Legend:** Not present as a separate element; model identification is via the y-axis labels.
### Detailed Analysis
The models and their corresponding scores, listed from top (highest score) to bottom (lowest score), are as follows:
| Rank | Model Name | Score (%) |
| :--- | :--- | :--- |
| 1 | EurusPRM-Stage1 | 54.6 |
| 2 | EurusPRM-Stage2 | 52.9 |
| 3 | Math-Shepherd-PRM-7B | 44.5 |
| 4 | Skywork-PRM-7B | 42.2 |
| 5 | Skywork-PRM-1.5B | 30.9 |
| 6 | Qwen2.5-Math-7B-PRM800K | 26.8 |
| 7 | Qwen2.5-Math-PRM-72B | 18.0 |
| 8 | Qwen2.5-Math-PRM-7B | 17.5 |
| 9 | RLHF-PRM-Deepseek-8B | 17.3 |
| 10 | Qwen2.5-Math-7B-Math-Shepherd | 9.8 |
| 11 | RLHF-PRM-Mistral-8B | 9.1 |
**Trend Verification:** The visual trend is a clear, stepwise decrease in bar length from the top model to the bottom model. The two "EurusPRM" models form a distinct top tier, both scoring above 50%. There is a significant drop of over 8 percentage points between the 2nd and 3rd ranked models. Another notable drop occurs between the 5th and 6th models (from 30.9% to 26.8%). The bottom four models all score below 20%.
### Key Observations
* **Top Performers:** The "EurusPRM" series (Stage1 and Stage2) significantly outperforms all other models listed, with scores above 50%.
* **Model Family Clustering:** Models from the same family or with similar naming conventions tend to cluster together in performance. For example, the two "Skywork-PRM" models are adjacent, and three "Qwen2.5-Math" variants are grouped in the lower half.
* **Performance Gap:** There is a large performance gap (approximately 25.5 percentage points) between the highest-scoring model (EurusPRM-Stage1) and the lowest-scoring model (RLHF-PRM-Mistral-8B).
* **Parameter Size vs. Performance:** The chart does not show a simple correlation between model parameter size (e.g., 7B, 72B, 8B) and score. For instance, "Qwen2.5-Math-PRM-72B" (18.0%) scores lower than the smaller "Skywork-PRM-1.5B" (30.9%).
### Interpretation
This chart provides a comparative benchmark of AI models on a specific evaluation metric, likely related to reasoning or problem-solving where a "minimum score at the last step" is a meaningful measure of reliability or correctness. The data suggests that the training methodology or architecture used in the "EurusPRM" models is substantially more effective for this particular task than the approaches used in the other listed models, which include variants using Math-Shepherd, Skywork, Qwen, and RLHF-based methods.
The clustering of results indicates that the underlying technique (e.g., PRM - Process Reward Model, RLHF) and the base model family are stronger determinants of performance on this metric than sheer model size alone. The chart serves as a leaderboard, highlighting which models are currently leading in this specific evaluation dimension and quantifying the performance differences between them. The significant variance in scores (from ~9% to ~55%) underscores that model selection for tasks requiring high final-step reliability is critical.