## Chart/Diagram Type: Multi-Panel Performance Evaluation
### Overview
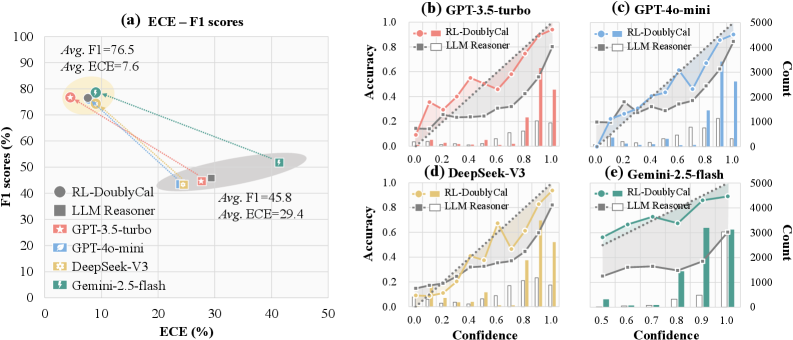
The image presents a multi-panel figure evaluating the performance of different language models. Panel (a) shows a scatter plot of F1 scores vs. ECE (Expected Calibration Error) for various models. Panels (b) through (e) display accuracy vs. confidence plots, along with count histograms, for specific models. The models compared are GPT-3.5-turbo, GPT-4o-mini, DeepSeek-V3, and Gemini-2.5-flash, along with RL-DoublyCal and LLM Reasoner baselines.
### Components/Axes
**Panel (a): ECE - F1 scores**
* **Title:** ECE – F1 scores
* **X-axis:** ECE (%) - Expected Calibration Error in percentage. Scale ranges from 0 to 50.
* **Y-axis:** F1 scores (%) - F1 scores in percentage. Scale ranges from 0 to 100.
* **Legend (Left):**
* RL-DoublyCal (Dark Gray Circle)
* LLM Reasoner (Gray Square)
* GPT-3.5-turbo (Red Star)
* GPT-4o-mini (Light Blue Teardrop)
* DeepSeek-V3 (Yellow Hexagon)
* Gemini-2.5-flash (Green Lightning Bolt)
* **Annotations:**
* Avg. F1 = 76.5, Avg. ECE = 7.6 (Located near the top-left, highlighted by a yellow ellipse)
* Avg. F1 = 45.8, Avg. ECE = 29.4 (Located near the bottom-right, highlighted by a gray ellipse)
**Panels (b) - (e): Accuracy vs. Confidence**
* **Titles:**
* (b) GPT-3.5-turbo
* (c) GPT-4o-mini
* (d) DeepSeek-V3
* (e) Gemini-2.5-flash
* **Left Y-axis:** Accuracy. Scale ranges from 0.0 to 1.0 in increments of 0.2.
* **Right Y-axis:** Count. Scale varies by panel.
* (b) 0 to 15000
* (c) 0 to 5000
* (d) 0 to 15000
* (e) 0 to 5000
* **X-axis:** Confidence. Scale ranges from 0.0 to 1.0 in increments of 0.2 for (b), (c), and (d). For (e), the scale ranges from 0.5 to 1.0 in increments of 0.1.
* **Legend (Top-Right of each panel):**
* RL-DoublyCal (Colored Line with Circles)
* LLM Reasoner (Gray Line with Squares)
* **Histograms:** Represent the count of predictions at each confidence level.
### Detailed Analysis
**Panel (a): ECE - F1 scores**
* **RL-DoublyCal:** F1 ~76%, ECE ~8% (Dark Gray Circle)
* **LLM Reasoner:** F1 ~46%, ECE ~30% (Gray Square)
* **GPT-3.5-turbo:** F1 ~77%, ECE ~7% (Red Star)
* **GPT-4o-mini:** F1 ~75%, ECE ~9% (Light Blue Teardrop)
* **DeepSeek-V3:** F1 ~77%, ECE ~7% (Yellow Hexagon)
* **Gemini-2.5-flash:** F1 ~52%, ECE ~42% (Green Lightning Bolt)
**Panels (b) - (e): Accuracy vs. Confidence**
* **GPT-3.5-turbo (b):**
* RL-DoublyCal (Red): Accuracy increases with confidence, starting around 0.1 at 0.0 confidence and reaching approximately 0.8 at 1.0 confidence.
* LLM Reasoner (Gray): Accuracy remains relatively flat around 0.2-0.3 across all confidence levels.
* Histogram: Shows a higher count of predictions at higher confidence levels.
* **GPT-4o-mini (c):**
* RL-DoublyCal (Blue): Accuracy increases with confidence, starting around 0.1 at 0.0 confidence and reaching approximately 0.9 at 1.0 confidence.
* LLM Reasoner (Gray): Accuracy increases slightly with confidence, from about 0.1 to 0.3.
* Histogram: Shows a higher count of predictions at higher confidence levels.
* **DeepSeek-V3 (d):**
* RL-DoublyCal (Yellow): Accuracy increases with confidence, starting around 0.1 at 0.0 confidence and reaching approximately 0.9 at 1.0 confidence.
* LLM Reasoner (Gray): Accuracy increases slightly with confidence, from about 0.1 to 0.4.
* Histogram: Shows a higher count of predictions at higher confidence levels.
* **Gemini-2.5-flash (e):**
* RL-DoublyCal (Green): Accuracy increases with confidence, starting around 0.3 at 0.5 confidence and reaching approximately 0.5 at 1.0 confidence.
* LLM Reasoner (Gray): Accuracy increases with confidence, from about 0.1 to 0.3.
* Histogram: Shows a higher count of predictions at higher confidence levels.
### Key Observations
* **Panel (a):** Models like GPT-3.5-turbo, GPT-4o-mini, and DeepSeek-V3 exhibit high F1 scores and low ECE, indicating good performance and calibration. LLM Reasoner has a lower F1 score and higher ECE. Gemini-2.5-flash has a moderate F1 score but a very high ECE.
* **Panels (b) - (e):** RL-DoublyCal consistently shows increasing accuracy with increasing confidence across all models. LLM Reasoner generally has lower accuracy and a flatter confidence curve. The histograms indicate that the models tend to make more predictions at higher confidence levels.
### Interpretation
The data suggests that RL-DoublyCal is effective in improving the calibration of language models, as evidenced by the increasing accuracy with confidence in panels (b) through (e). Models like GPT-3.5-turbo, GPT-4o-mini, and DeepSeek-V3, when combined with RL-DoublyCal, achieve both high accuracy and good calibration. LLM Reasoner, on the other hand, appears to be less reliable in terms of calibration. Gemini-2.5-flash shows a significant calibration issue, as indicated by its high ECE value. The relationship between F1 score and ECE in panel (a) highlights the trade-off between accuracy and calibration, with some models prioritizing one over the other. The histograms provide insights into the confidence distribution of the models' predictions.