TECHNICAL ASSET FINGERPRINT
7f36bb2d911e0d372bfe9c68
Click to view fullscreen
Press ESC or click to close
FOUND IN PAPERS
EXPERT: healer-alpha-free VERSION 1
RUNTIME: free/openrouter/healer-alpha
INTEL_VERIFIED
## Composite Figure: Model Performance and Calibration Analysis
### Overview
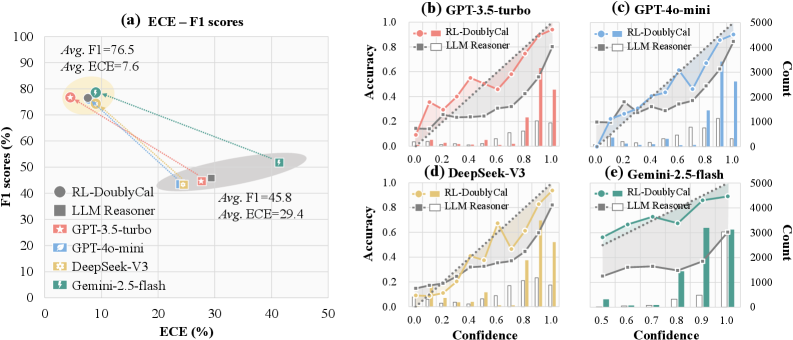
This image is a composite technical figure containing five subplots (labeled a-e) that compare the performance and calibration of two methods ("RL-DoublyCal" and "LLM Reasoner") across four different Large Language Models (LLMs). The figure evaluates these methods using metrics like F1 score, Expected Calibration Error (ECE), accuracy, and confidence distributions.
### Components/Axes
The figure is divided into two main sections:
1. **Left Section (Subplot a):** A scatter plot comparing F1 scores and ECE.
2. **Right Section (Subplots b-e):** A 2x2 grid of calibration plots, each for a specific LLM.
**Common Elements:**
* **Legend (Present in all subplots):**
* `RL-DoublyCal`: Represented by solid lines with filled markers (circle in (a), square in (b-e)).
* `LLM Reasoner`: Represented by dashed lines with hollow square markers.
* **LLM-Specific Colors (Consistent across all subplots):**
* GPT-3.5-turbo: Red/Salmon
* GPT-4o-mini: Blue
* DeepSeek-V3: Gold/Yellow
* Gemini-2.5-flash: Teal/Green
### Detailed Analysis
#### **Subplot (a): ECE – F1 scores**
* **Type:** Scatter plot.
* **X-axis:** `ECE (%)` (Expected Calibration Error). Scale: 0 to 50.
* **Y-axis:** `F1 scores (%)`. Scale: 0 to 100.
* **Data Points & Trends:**
* **Cluster 1 (Top-Left):** Contains the `RL-DoublyCal` results for all four LLMs. These points are grouped closely together, indicating high F1 scores and low ECE.
* **Annotation:** `Avg. F1=76.5`, `Avg. ECE=7.6`.
* **Approximate Values:**
* GPT-3.5-turbo (Red Circle): F1 ~78%, ECE ~5%
* GPT-4o-mini (Blue Circle): F1 ~76%, ECE ~8%
* DeepSeek-V3 (Gold Circle): F1 ~75%, ECE ~7%
* Gemini-2.5-flash (Teal Circle): F1 ~77%, ECE ~10%
* **Cluster 2 (Bottom-Right):** Contains the `LLM Reasoner` results for all four LLMs. These points are grouped together, indicating lower F1 scores and higher ECE.
* **Annotation:** `Avg. F1=45.8`, `Avg. ECE=29.4`.
* **Approximate Values:**
* GPT-3.5-turbo (Red Square): F1 ~48%, ECE ~28%
* GPT-4o-mini (Blue Square): F1 ~46%, ECE ~27%
* DeepSeek-V3 (Gold Square): F1 ~44%, ECE ~30%
* Gemini-2.5-flash (Teal Square): F1 ~45%, ECE ~32%
* **Visual Trend:** Lines connect the `RL-DoublyCal` and `LLM Reasoner` points for each LLM, showing a consistent, significant drop in F1 score and a large increase in ECE when moving from the former to the latter method.
#### **Subplots (b-e): Calibration Plots (Accuracy vs. Confidence)**
Each subplot shares the same structure:
* **X-axis:** `Confidence`. Scale: 0.0 to 1.0.
* **Left Y-axis:** `Accuracy`. Scale: 0.0 to 1.0.
* **Right Y-axis:** `Count` (for the histogram). Scale varies per plot (0-1000, 0-5000).
* **Data Series:**
1. **Line Plot (Accuracy):** Shows model accuracy at different confidence bins.
2. **Bar Histogram (Count):** Shows the number of predictions (frequency) in each confidence bin.
**Subplot (b): GPT-3.5-turbo**
* **RL-DoublyCal (Red Solid Line):** Accuracy increases steadily with confidence, reaching ~0.95 at confidence 1.0. The histogram (red bars) shows predictions are distributed across the confidence range, with a peak around 0.9-1.0.
* **LLM Reasoner (Grey Dashed Line):** Accuracy increases more slowly and is consistently lower than RL-DoublyCal at most confidence levels, reaching only ~0.7 at confidence 1.0. The histogram (grey bars) shows a strong skew towards very high confidence (0.9-1.0), indicating overconfidence despite lower accuracy.
**Subplot (c): GPT-4o-mini**
* **RL-DoublyCal (Blue Solid Line):** Accuracy shows a strong, nearly linear increase with confidence, reaching ~0.9 at confidence 1.0. The histogram (blue bars) shows a broad distribution with a significant number of predictions across all confidence levels.
* **LLM Reasoner (Grey Dashed Line):** Accuracy is lower and plateaus around 0.6-0.7 for confidence >0.6. The histogram (grey bars) is heavily skewed towards the highest confidence bin (1.0), showing extreme overconfidence.
**Subplot (d): DeepSeek-V3**
* **RL-DoublyCal (Gold Solid Line):** Accuracy increases with confidence, reaching ~0.9 at confidence 1.0. The histogram (gold bars) shows a distribution skewed towards higher confidence.
* **LLM Reasoner (Grey Dashed Line):** Accuracy is significantly lower, especially at high confidence, reaching only ~0.65 at confidence 1.0. The histogram (grey bars) shows a very strong peak at confidence 1.0, indicating severe overconfidence.
**Subplot (e): Gemini-2.5-flash**
* **RL-DoublyCal (Teal Solid Line):** Accuracy increases with confidence, reaching ~0.85 at confidence 1.0. The histogram (teal bars) shows a distribution with peaks around 0.8 and 1.0.
* **LLM Reasoner (Grey Dashed Line):** Accuracy is lower and relatively flat above confidence 0.7, hovering around 0.6. The histogram (grey bars) shows a massive concentration of predictions in the 0.9-1.0 confidence range, the most extreme overconfidence pattern among the four LLMs.
### Key Observations
1. **Performance Dichotomy:** There is a stark and consistent separation between the two methods across all LLMs. `RL-DoublyCal` occupies the high-performance, well-calibrated region (high F1, low ECE), while `LLM Reasoner` occupies the low-performance, poorly-calibrated region (low F1, high ECE).
2. **Calibration vs. Overconfidence:** The calibration plots (b-e) visually explain the high ECE for `LLM Reasoner`. Its accuracy lines (grey dashed) are consistently below the ideal diagonal (where accuracy would equal confidence), and its histograms are heavily skewed to the right. This means it assigns high confidence to many predictions that are incorrect.
3. **Consistency Across LLMs:** The relative advantage of `RL-DoublyCal` over `LLM Reasoner` is observed for all four tested LLMs (GPT-3.5-turbo, GPT-4o-mini, DeepSeek-V3, Gemini-2.5-flash), suggesting the finding is robust to the underlying model architecture.
4. **Magnitude of Improvement:** The average improvement from `LLM Reasoner` to `RL-DoublyCal` is substantial: an increase of ~30.7 percentage points in F1 score and a decrease of ~21.8 percentage points in ECE.
### Interpretation
This figure presents strong empirical evidence that the `RL-DoublyCal` method significantly outperforms the `LLM Reasoner` baseline in both **effectiveness** (higher F1 scores) and **reliability** (lower calibration error).
* **What the data suggests:** The `LLM Reasoner` exhibits a classic failure mode of AI systems: **overconfidence**. It makes predictions with very high confidence (as seen in the histograms) but its actual accuracy at those confidence levels is poor (as seen in the accuracy lines). This makes its outputs untrustworthy for decision-making. In contrast, `RL-DoublyCal` produces confidence scores that are much more aligned with its actual accuracy, making it a more reliable system.
* **How elements relate:** Subplot (a) provides the high-level summary of the performance gap. Subplots (b-e) diagnose the *cause* of the poor ECE for `LLM Reasoner`—a systematic mismatch between confidence and accuracy. The consistent color coding links the specific LLM's performance in (a) to its detailed calibration behavior in (b-e).
* **Notable implications:** The results imply that the technique used in `RL-DoublyCal` (likely involving reinforcement learning for calibration) effectively mitigates the overconfidence problem inherent in standard LLM reasoning. This is critical for deploying LLMs in high-stakes domains (e.g., medicine, finance) where knowing the certainty of a model's output is as important as the output itself. The figure effectively argues that `RL-DoublyCal` produces models that are not only more accurate but also know what they don't know.
DECODING INTELLIGENCE...