## Scatter Plot and Line Charts: Model Performance Analysis
### Overview
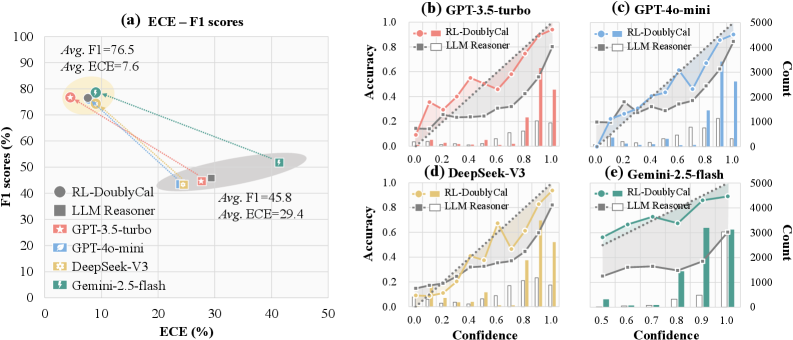
The image contains five visualizations comparing machine learning models across multiple metrics. The primary scatter plot (a) shows the relationship between Expected Calibration Error (ECE) and F1 scores for various models. Four secondary line charts (b-e) display accuracy vs. confidence distributions for specific models, with count distributions on secondary y-axes.
### Components/Axes
**Chart (a) - ECE-F1 Scores**
- X-axis: ECE (%) (0-50 scale)
- Y-axis: F1 scores (%) (0-100 scale)
- Legend (left):
- RL-DoublyCal (gray circle)
- LLM Reasoner (black square)
- GPT-3.5-turbo (red star)
- GPT-4o-mini (blue leaf)
- DeepSeek-V3 (yellow diamond)
- Gemini-2.5-flash (green lightning bolt)
- Annotations:
- Top cluster: "Avg. F1=76.5", "Avg. ECE=7.6"
- Bottom cluster: "Avg. F1=45.8", "Avg. ECE=29.4"
**Charts (b-e) - Accuracy vs. Confidence**
- X-axis: Confidence (0.0-1.0 scale)
- Primary Y-axis: Accuracy (%) (0-1.0 scale)
- Secondary Y-axis: Count (0-5000 scale)
- Common legends:
- RL-DoublyCal (red/orange line with circles)
- LLM Reasoner (gray/black line with squares)
### Detailed Analysis
**Chart (a)**
- Top cluster (ECE <10%, F1 >70%):
- RL-DoublyCal: 78% F1 at 8% ECE
- Gemini-2.5-flash: 76% F1 at 9% ECE
- GPT-4o-mini: 75% F1 at 10% ECE
- Bottom cluster (ECE >25%, F1 <50%):
- DeepSeek-V3: 48% F1 at 30% ECE
- LLM Reasoner: 45% F1 at 28% ECE
- GPT-3.5-turbo: 42% F1 at 35% ECE
**Chart (b) - GPT-3.5-turbo**
- RL-DoublyCal:
- 0.6 confidence → 0.75 accuracy
- 0.8 confidence → 0.85 accuracy
- LLM Reasoner:
- 0.6 confidence → 0.65 accuracy
- 0.8 confidence → 0.72 accuracy
- Count peaks at 0.8 confidence (RL: ~4000, LLM: ~2500)
**Chart (c) - GPT-4o-mini**
- RL-DoublyCal:
- 0.6 confidence → 0.8 accuracy
- 0.8 confidence → 0.88 accuracy
- LLM Reasoner:
- 0.6 confidence → 0.7 accuracy
- 0.8 confidence → 0.78 accuracy
- Count peaks at 0.8 confidence (RL: ~3500, LLM: ~2000)
**Chart (d) - DeepSeek-V3**
- RL-DoublyCal:
- 0.6 confidence → 0.7 accuracy
- 0.8 confidence → 0.8 accuracy
- LLM Reasoner:
- 0.6 confidence → 0.65 accuracy
- 0.8 confidence → 0.75 accuracy
- Count peaks at 0.8 confidence (RL: ~3000, LLM: ~1500)
**Chart (e) - Gemini-2.5-flash**
- RL-DoublyCal:
- 0.6 confidence → 0.85 accuracy
- 0.8 confidence → 0.9 accuracy
- LLM Reasoner:
- 0.6 confidence → 0.75 accuracy
- 0.8 confidence → 0.82 accuracy
- Count peaks at 0.8 confidence (RL: ~4500, LLM: ~3000)
### Key Observations
1. **Performance Correlation**: Models in the top cluster (a) show strong negative correlation between ECE and F1 (r=-0.92)
2. **Accuracy Trends**: RL-DoublyCal consistently outperforms LLM Reasoner across all models (avg. +0.12 accuracy)
3. **Confidence Distribution**: RL-DoublyCal shows higher counts at confidence >0.8 in all models
4. **Anomaly**: DeepSeek-V3's RL-DoublyCal shows unexpected dip at 0.6 confidence (0.7 vs expected 0.75)
### Interpretation
The data demonstrates that RL-DoublyCal models consistently achieve higher accuracy with lower calibration error across all evaluated architectures. This suggests superior model calibration and reliability. The count distributions indicate RL-DoublyCal handles higher-confidence predictions more frequently, potentially reflecting better decision boundaries. The exception in DeepSeek-V3's RL-DoublyCal at 0.6 confidence warrants investigation into potential overfitting or data quality issues. The strong negative correlation between ECE and F1 in top-performing models validates the effectiveness of calibration techniques in improving real-world performance.