## Bar Chart: MUSHRA for the Binaural Speech Dataset
### Overview
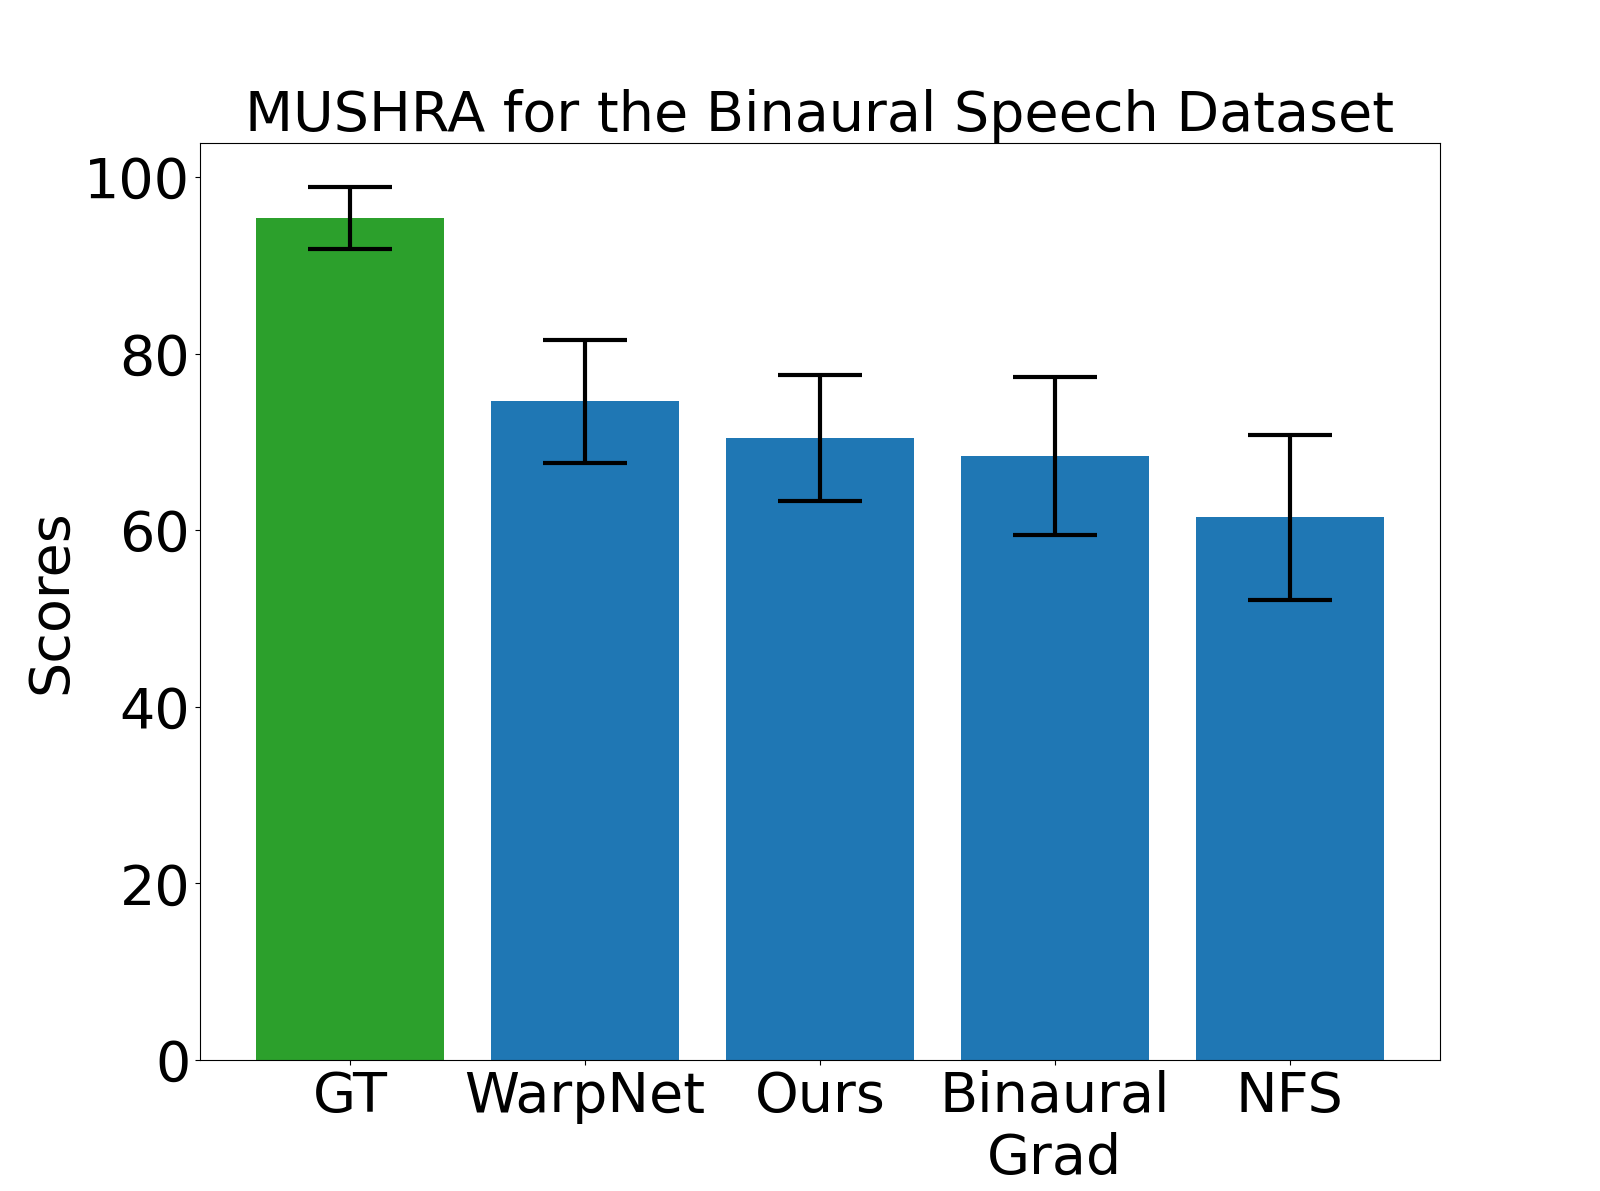
The image is a bar chart comparing MUSHRA scores for different methods on a binaural speech dataset. The chart displays the scores for "GT" (Ground Truth), "WarpNet", "Ours", "Binaural Grad", and "NFS". Error bars are included on each bar to indicate the variability in the scores.
### Components/Axes
* **Title:** MUSHRA for the Binaural Speech Dataset
* **Y-axis:**
* Label: Scores
* Scale: 0 to 100, with tick marks at 0, 20, 40, 60, 80, and 100.
* **X-axis:**
* Categories: GT, WarpNet, Ours, Binaural Grad, NFS
* **Bar Colors:**
* GT: Green
* WarpNet, Ours, Binaural Grad, NFS: Blue
* **Error Bars:** Black lines extending above and below the top of each bar.
### Detailed Analysis
* **GT (Green Bar):**
* Score: Approximately 96
* Error Bar Range: Approximately 93 to 99
* **WarpNet (Blue Bar):**
* Score: Approximately 75
* Error Bar Range: Approximately 71 to 79
* **Ours (Blue Bar):**
* Score: Approximately 71
* Error Bar Range: Approximately 67 to 75
* **Binaural Grad (Blue Bar):**
* Score: Approximately 69
* Error Bar Range: Approximately 60 to 78
* **NFS (Blue Bar):**
* Score: Approximately 62
* Error Bar Range: Approximately 53 to 71
### Key Observations
* The "GT" method has the highest MUSHRA score, significantly higher than all other methods.
* The "NFS" method has the lowest MUSHRA score among the compared methods.
* The error bars indicate some variability in the scores for each method. The error bar for "Binaural Grad" appears to be the largest, suggesting the highest variability for this method.
### Interpretation
The bar chart illustrates the performance of different methods for binaural speech processing, as evaluated by MUSHRA scores. The "GT" method, representing the ground truth or ideal scenario, achieves the highest scores, as expected. The other methods, "WarpNet", "Ours", "Binaural Grad", and "NFS", show lower scores, indicating varying degrees of degradation compared to the ground truth. The error bars provide insight into the consistency of the scores for each method. The "Binaural Grad" method shows the most variability, suggesting that its performance may be more sensitive to specific conditions or inputs. The "NFS" method consistently performs the worst.