\n
## Bar Chart: MUSHA for the Binaural Speech Dataset
### Overview
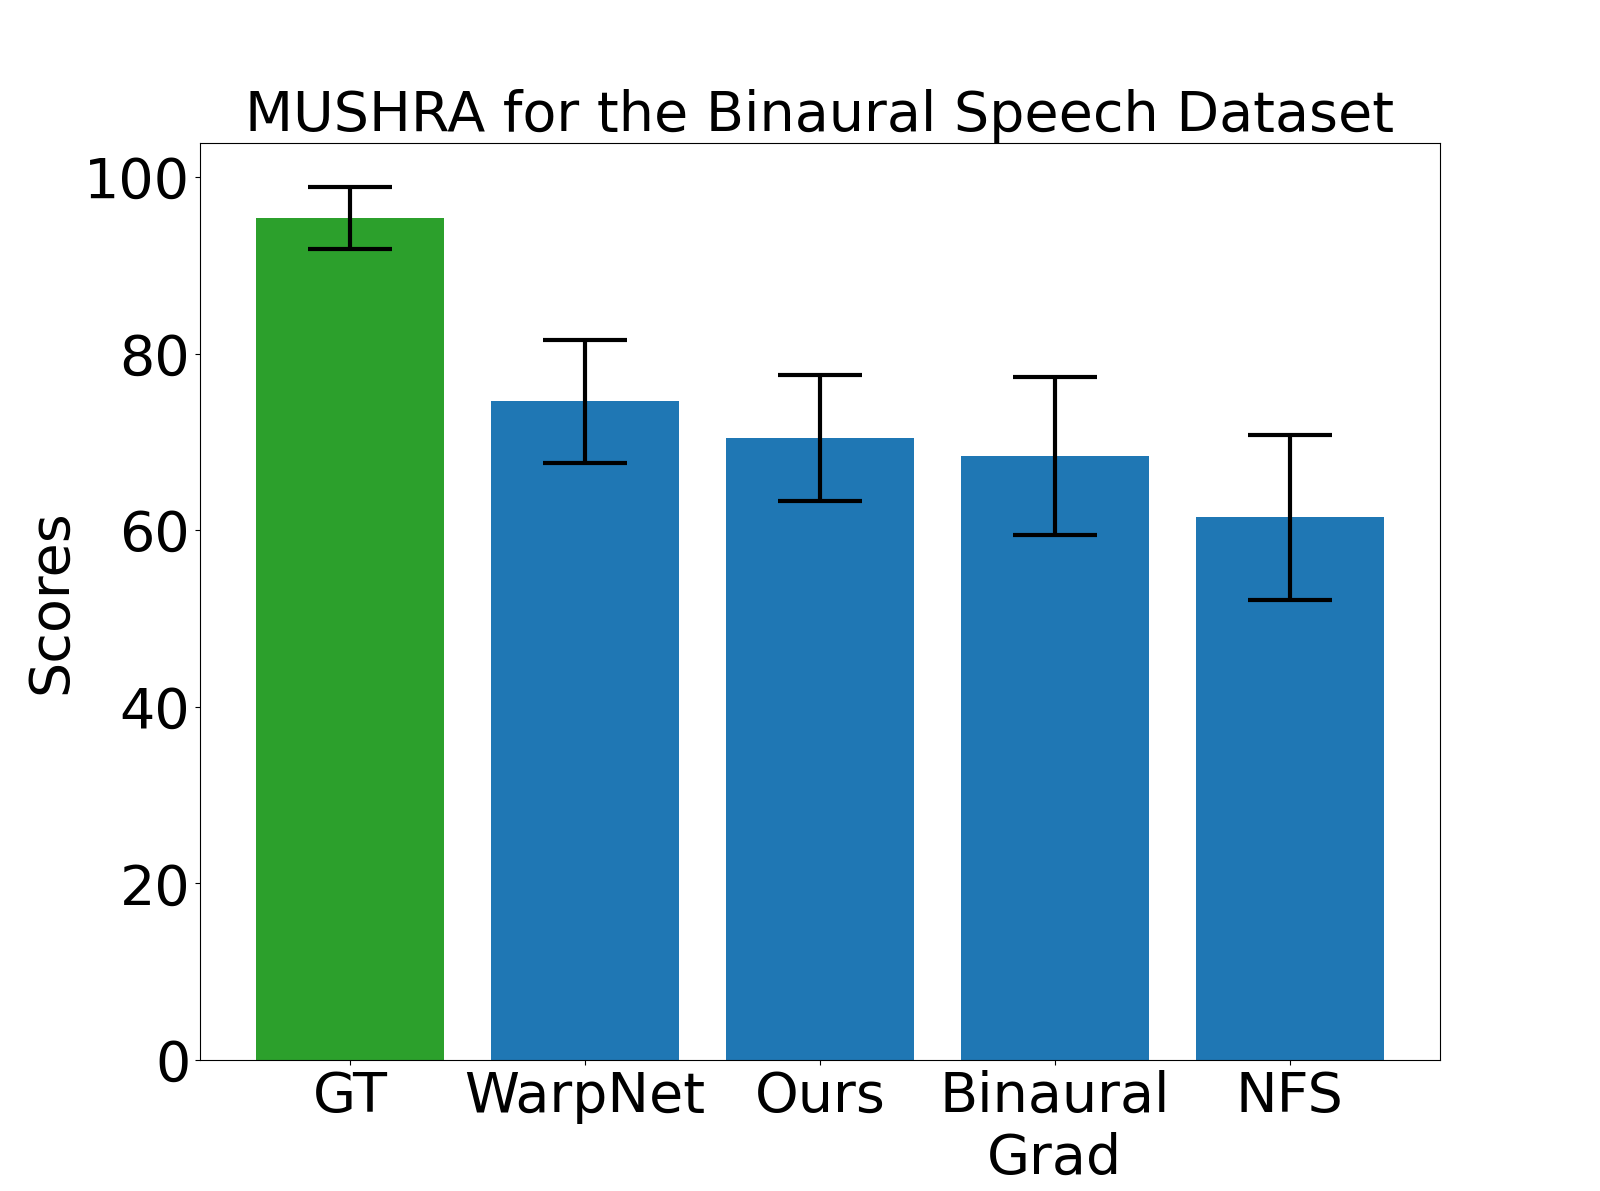
This bar chart presents the results of a MUSHA (Multi-channel Unified Subjective Hearing Assessment) evaluation for the Binaural Speech Dataset. It compares the scores achieved by different methods: GT (Ground Truth), WarpNet, Ours, Binaural Grad, and NFS. Each bar represents the average score for a method, with error bars indicating the variability or confidence interval around that average.
### Components/Axes
* **Title:** "MUSHA for the Binaural Speech Dataset" - positioned at the top-center of the chart.
* **X-axis:** Labels representing the different methods being compared: "GT", "WarpNet", "Ours", "Binaural Grad", "NFS".
* **Y-axis:** Labeled "Scores", with a scale ranging from 0 to 100, incrementing by 20.
* **Bars:** Represent the average MUSHA scores for each method.
* **Error Bars:** Vertical lines extending above and below each bar, indicating the standard error or confidence interval.
### Detailed Analysis
The chart displays five bars, each representing a different method. The bars are colored as follows:
* **GT (Ground Truth):** Green
* **WarpNet:** Blue
* **Ours:** Blue
* **Binaural Grad:** Blue
* **NFS:** Blue
Let's analyze the approximate scores and error bar ranges:
* **GT:** The green bar is the tallest, indicating the highest average score. The bar reaches approximately 94 on the Y-axis. The error bar extends from approximately 90 to 98.
* **WarpNet:** The first blue bar has a height of approximately 75. The error bar extends from approximately 70 to 80.
* **Ours:** The second blue bar has a height of approximately 73. The error bar extends from approximately 68 to 78.
* **Binaural Grad:** The third blue bar has a height of approximately 72. The error bar extends from approximately 67 to 77.
* **NFS:** The last blue bar has a height of approximately 65. The error bar extends from approximately 60 to 70.
### Key Observations
* The Ground Truth (GT) method significantly outperforms all other methods, achieving the highest average score.
* WarpNet, Ours, and Binaural Grad achieve relatively similar scores, all falling within the 70-75 range.
* NFS has the lowest average score among the compared methods.
* The error bars for all methods overlap to some extent, suggesting that the differences between some methods may not be statistically significant.
### Interpretation
The data suggests that the Ground Truth method provides the best performance in terms of subjective audio quality, as measured by the MUSHA metric. The other methods (WarpNet, Ours, Binaural Grad, and NFS) perform considerably worse, but are relatively close in their performance. The overlap in error bars indicates that the differences between these methods may not be substantial.
The chart demonstrates the effectiveness of the Ground Truth method as a benchmark for evaluating the performance of other audio processing techniques. It also highlights the challenges in achieving audio quality comparable to the original, unprocessed signal. The relatively low scores for the other methods suggest that there is room for improvement in the development of algorithms for binaural speech processing. The fact that the error bars overlap suggests that further testing with a larger dataset may be needed to determine whether the differences between WarpNet, Ours, Binaural Grad, and NFS are statistically significant.