TECHNICAL ASSET FINGERPRINT
7f46f1f75bcddc1606b4f907
Click to view fullscreen
Press ESC or click to close
FOUND IN PAPERS
EXPERT: gemini-2.5-flash-free VERSION 1
RUNTIME: google-free/gemini-2.5-flash
INTEL_VERIFIED
## Multi-Environment Analysis of System Metrics and Intuition
### Overview
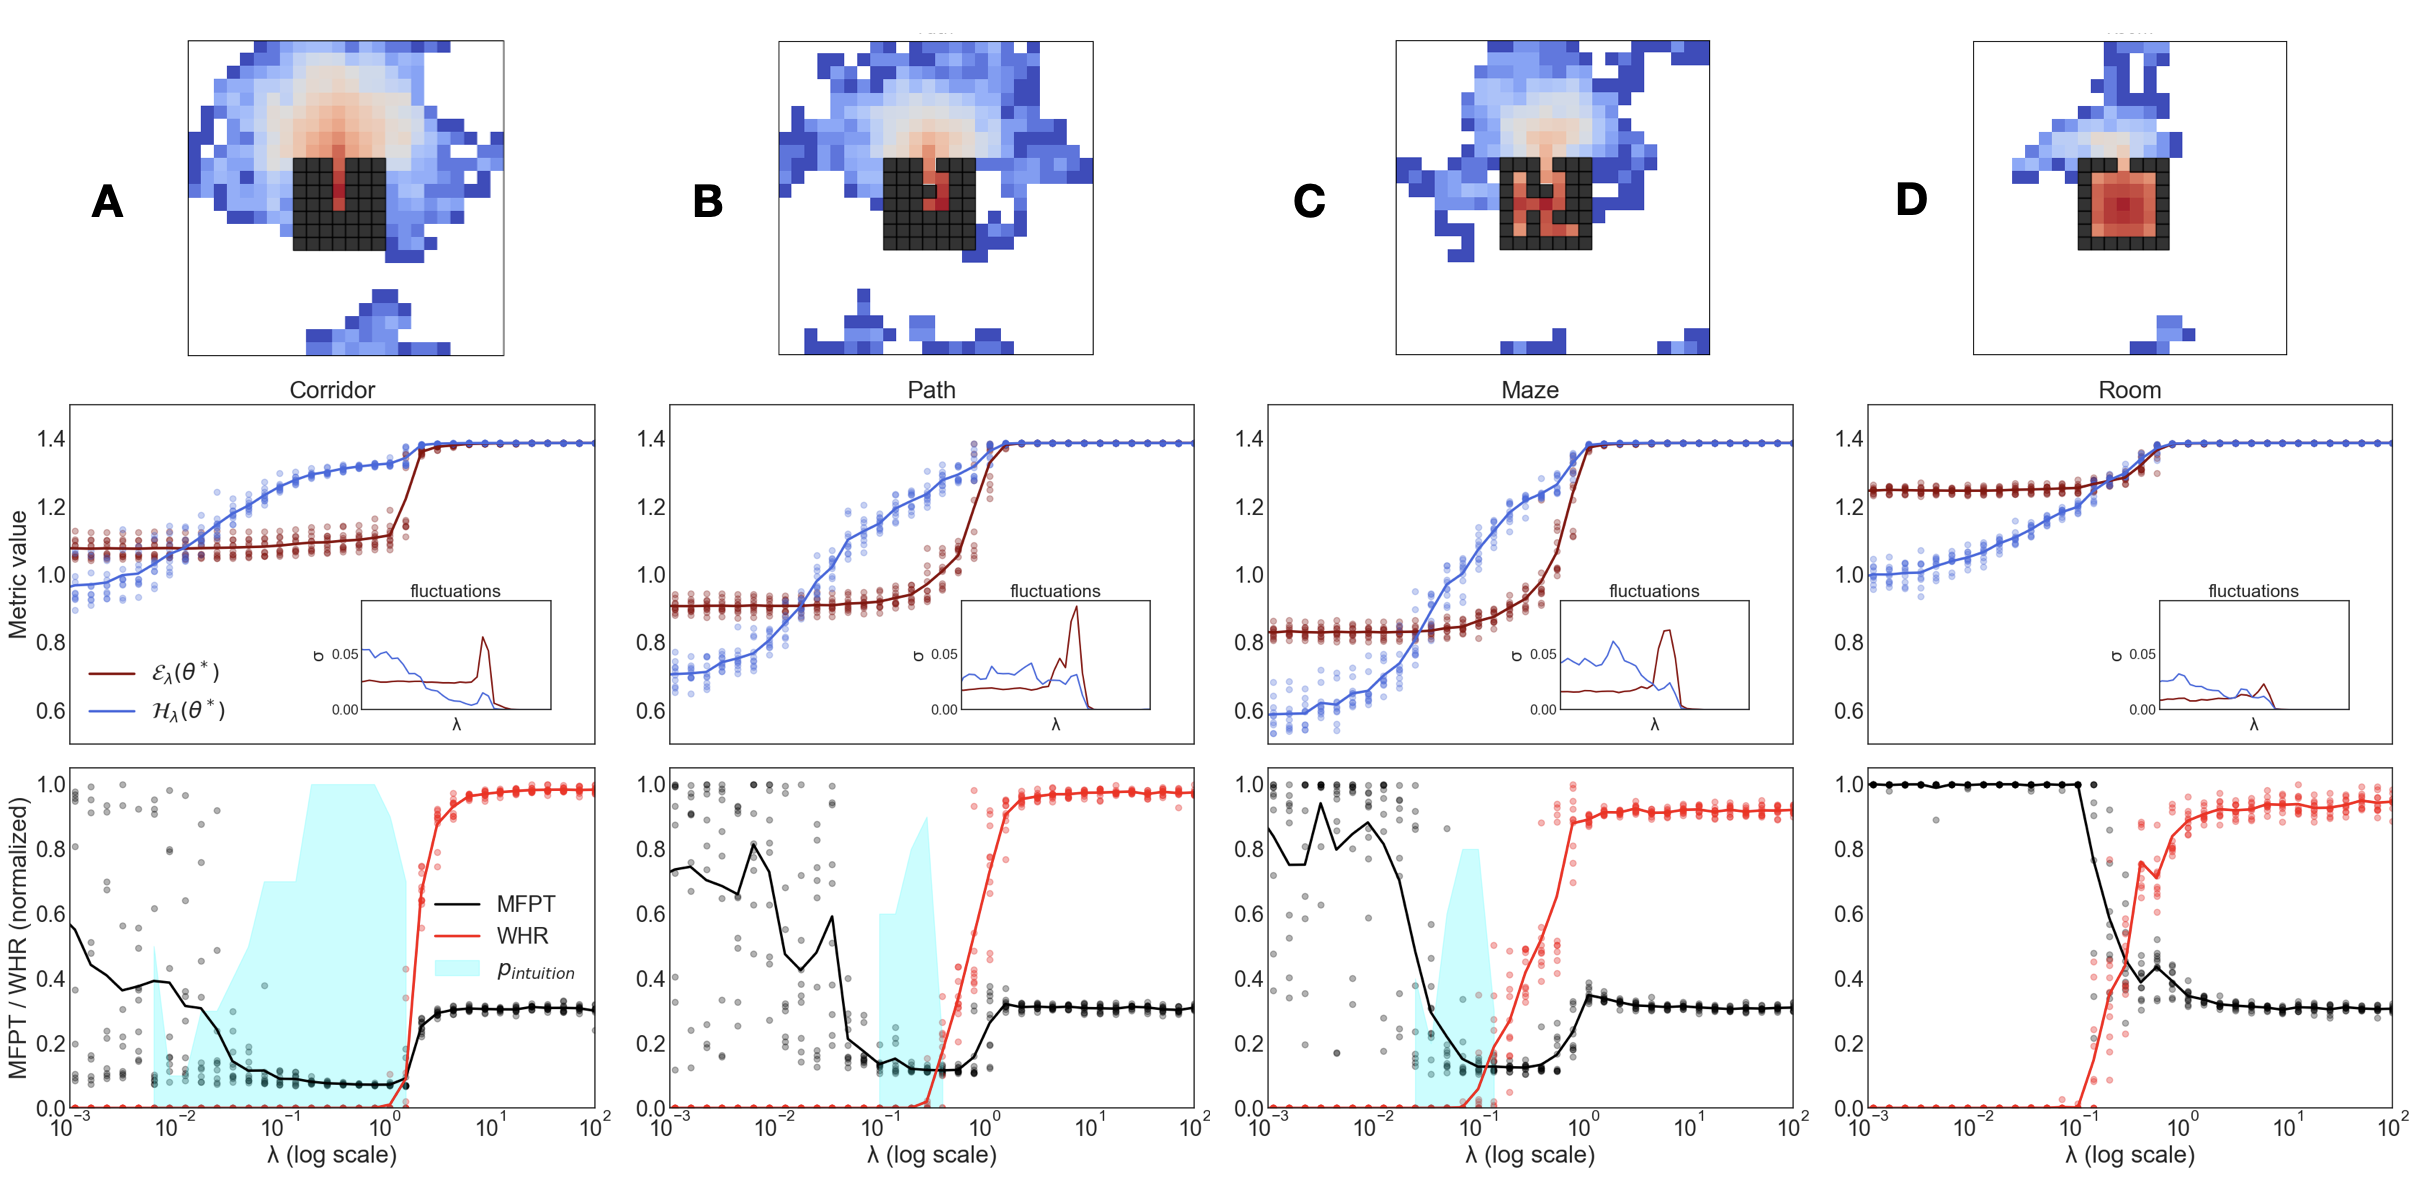
The image presents a comprehensive analysis across four distinct environments: "Corridor", "Path", "Maze", and "Room". It is structured as a 4-column by 3-row grid of plots. The top row (A-D) displays heatmaps illustrating spatial distributions within each environment. The middle row features line charts showing two "Metric value" curves, `E_λ(θ*)` and `H_λ(θ*)`, as a function of a logarithmic parameter `λ`, each with an inset chart detailing "fluctuations". The bottom row presents line charts depicting "MFPT", "WHR", and a shaded area representing "P_intuition", also as a function of `λ`. The overall aim appears to be to understand how system behavior, performance, and a concept of "intuition" vary with `λ` and environmental complexity.
### Components/Axes
The image is organized into four vertical columns, each dedicated to a specific environment, and three horizontal rows, each presenting a different type of visualization.
**Column Headers (located below the top row heatmaps):**
* Column 1: "Corridor"
* Column 2: "Path"
* Column 3: "Maze"
* Column 4: "Room"
**Row 1: Spatial Distribution Heatmaps**
* **Labels:** "A" (top-left), "B" (top-center-left), "C" (top-center-right), "D" (top-right).
* **Content:** Each panel displays a grid-based heatmap. A central dark grey/black block represents the physical structure or obstacles of the environment. The surrounding colored regions indicate a spatial distribution, likely density or value, with a color gradient from dark blue (lowest values) through light blue, white, light red, to dark red (highest values).
* **A (Corridor):** Features a vertical rectangular dark block in the center. The heatmap distribution is elongated vertically, with higher intensity (red/white) concentrated around the center of the corridor.
* **B (Path):** Shows an L-shaped dark block in the center. The distribution follows the L-shape, with higher intensity around the corner and extending along the arms.
* **C (Maze):** Contains a more intricate, H-shaped or cross-shaped dark block, resembling a small maze structure. The distribution shows higher intensity within the open pathways of this maze.
* **D (Room):** Displays a small, roughly square dark block in the center. The distribution is more circular or blob-like, centered around and slightly above the dark block, with higher intensity in that region.
**Row 2: Metric Value Charts**
* **Y-axis (leftmost chart, applies to all in this row):** "Metric value", scaled from 0.6 to 1.4, with major ticks at 0.6, 0.8, 1.0, 1.2, 1.4.
* **X-axis (applies to all in this row):** "λ" (lambda), a logarithmic scale ranging from 10^-3 to 10^2, with major ticks at 10^-3, 10^-2, 10^-1, 10^0, 10^1, 10^2.
* **Legend (bottom-left of the leftmost chart, applies to all in this row):**
* Dark Red line: `E_λ(θ*)`
* Blue line: `H_λ(θ*)`
* **Inset Charts (bottom-right of each main chart):**
* **Title:** "fluctuations"
* **Y-axis:** "b", scaled from 0.00 to 0.05, with major ticks at 0.00, 0.05.
* **X-axis:** "λ", implied to be the same logarithmic scale as the main chart.
* **Data Series:** Two lines, one dark red and one blue, corresponding to the main chart's legend.
**Row 3: MFPT / WHR (normalized) Charts**
* **Y-axis (leftmost chart, applies to all in this row):** "MFPT / WHR (normalized)", scaled from 0.0 to 1.0, with major ticks at 0.0, 0.2, 0.4, 0.6, 0.8, 1.0.
* **X-axis (applies to all in this row):** "λ (log scale)", scaled from 10^-3 to 10^2, with major ticks at 10^-3, 10^-2, 10^-1, 10^0, 10^1, 10^2.
* **Legend (bottom-left of the leftmost chart, applies to all in this row):**
* Black line: "MFPT"
* Red line: "WHR"
* Cyan shaded area: "P_intuition"
* **Additional elements:** Numerous light grey scattered data points are visible across the background of these charts, representing individual observations.
### Detailed Analysis
**Row 2: Metric Value Charts (`E_λ(θ*)` and `H_λ(θ*)` vs. λ)**
* **Column 1: Corridor**
* **`E_λ(θ*)` (Dark Red Line):** Starts around 1.1 at λ=10^-3, remains relatively flat until approximately λ=0.3 (10^-0.5), then sharply increases to about 1.38 by λ=1 (10^0), and stabilizes at 1.38.
* **`H_λ(θ*)` (Blue Line):** Starts around 0.95 at λ=10^-3, gradually increases, crosses `E_λ(θ*)` around λ=0.1 (10^-1) at a value of approximately 1.1, then increases more steeply to about 1.38 by λ=1 (10^0), and stabilizes at 1.38.
* **Fluctuations Inset:** The red line shows a peak of approximately 0.04 around λ=0.3. The blue line shows a broader, lower peak of about 0.02 around λ=0.1. Both lines are near 0.00 at the extremes.
* **Column 2: Path**
* **`E_λ(θ*)` (Dark Red Line):** Starts around 0.9 at λ=10^-3, remains relatively flat until approximately λ=0.3 (10^-0.5), then sharply increases to about 1.38 by λ=1 (10^0), and stabilizes at 1.38.
* **`H_λ(θ*)` (Blue Line):** Starts around 0.65 at λ=10^-3, gradually increases, crosses `E_λ(θ*)` around λ=0.1 (10^-1) at a value of approximately 0.95, then increases more steeply to about 1.38 by λ=1 (10^0), and stabilizes at 1.38.
* **Fluctuations Inset:** The red line shows a sharp peak of approximately 0.05 around λ=0.3. The blue line shows a broader, lower peak of about 0.02 around λ=0.1.
* **Column 3: Maze**
* **`E_λ(θ*)` (Dark Red Line):** Starts around 0.82 at λ=10^-3, remains relatively flat until approximately λ=0.3 (10^-0.5), then sharply increases to about 1.38 by λ=1 (10^0), and stabilizes at 1.38.
* **`H_λ(θ*)` (Blue Line):** Starts around 0.6 at λ=10^-3, gradually increases, crosses `E_λ(θ*)` around λ=0.1 (10^-1) at a value of approximately 0.88, then increases more steeply to about 1.38 by λ=1 (10^0), and stabilizes at 1.38.
* **Fluctuations Inset:** The red line shows a sharp peak of approximately 0.05 around λ=0.3. The blue line shows a broader, lower peak of about 0.02 around λ=0.1.
* **Column 4: Room**
* **`E_λ(θ*)` (Dark Red Line):** Starts around 1.25 at λ=10^-3, remains relatively flat until approximately λ=0.3 (10^-0.5), then sharply increases to about 1.38 by λ=1 (10^0), and stabilizes at 1.38.
* **`H_λ(θ*)` (Blue Line):** Starts around 1.0 at λ=10^-3, gradually increases, crosses `E_λ(θ*)` around λ=0.6 (10^-0.2) at a value of approximately 1.3, then increases more steeply to about 1.38 by λ=1 (10^0), and stabilizes at 1.38.
* **Fluctuations Inset:** The red line shows a small peak of approximately 0.02 around λ=0.3. The blue line shows a broader, lower peak of about 0.01 around λ=0.6.
**Row 3: MFPT / WHR (normalized) Charts (MFPT, WHR, P_intuition vs. λ)**
* **Column 1: Corridor**
* **MFPT (Black Line):** Starts around 0.45 at λ=10^-3, decreases to a minimum of approximately 0.05 around λ=0.1 (10^-1), then increases to about 0.3 at λ=1 (10^0), and stabilizes at 0.3.
* **WHR (Red Line):** Starts at 0.0 at λ=10^-3, remains at 0.0 until approximately λ=0.1 (10^-1), then sharply increases to 1.0 by λ=1 (10^0), and stabilizes at 1.0.
* **P_intuition (Cyan Shaded Area):** Forms a prominent peak between approximately λ=10^-2 and λ=10^0, centered around λ=0.1 (10^-1), reaching a maximum normalized value of approximately 0.9.
* **Scattered Points (Grey):** Widely distributed
DECODING INTELLIGENCE...