\n
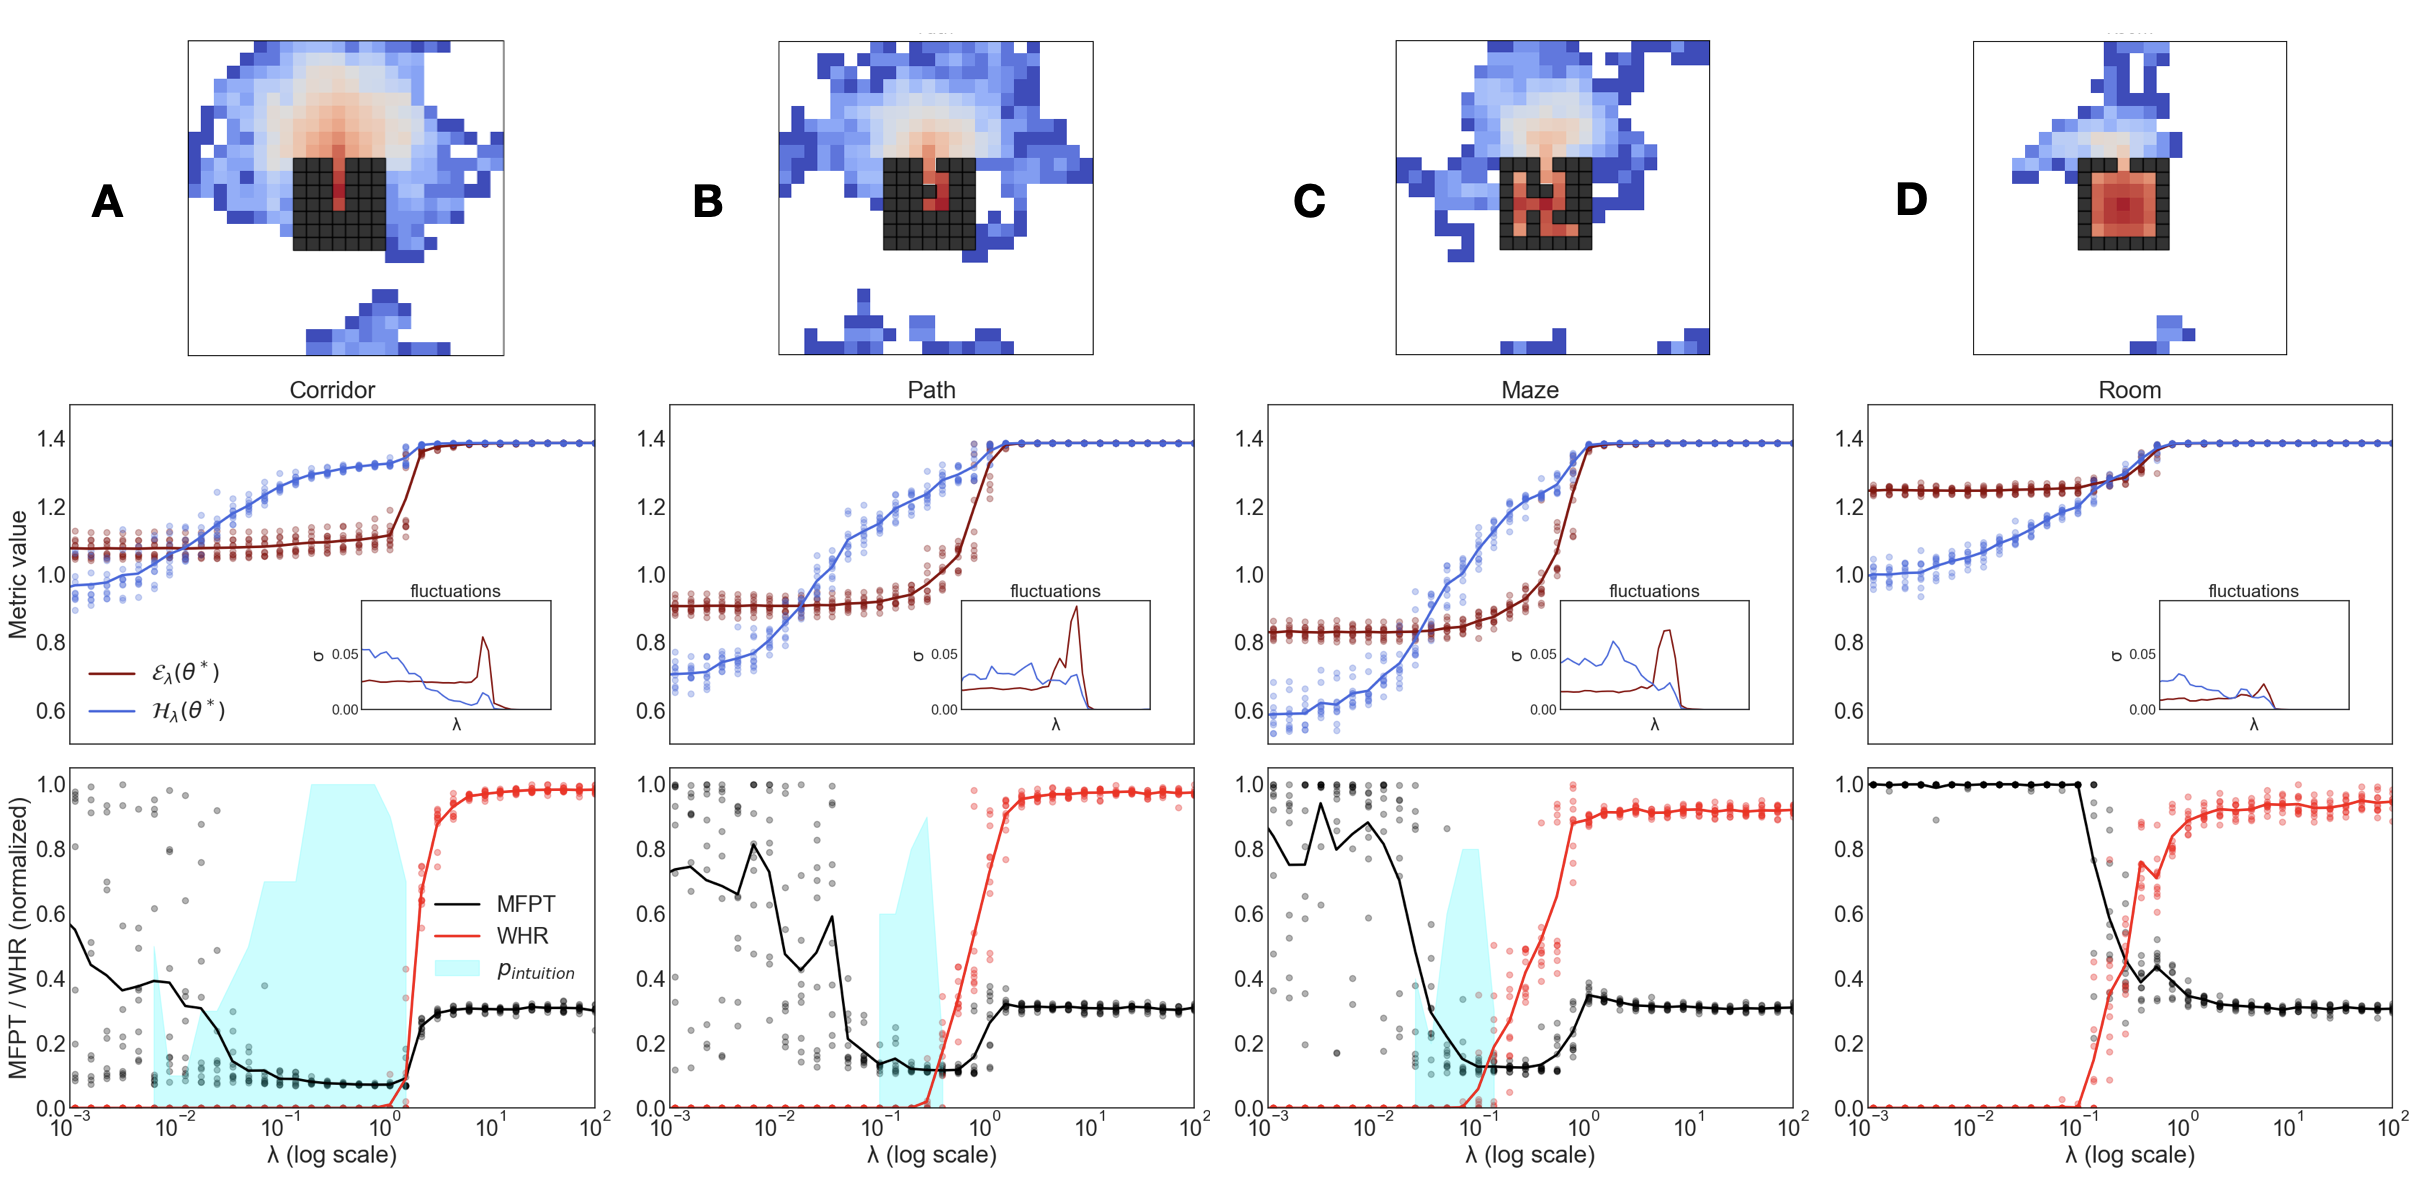
## Chart: Spatial Exploration Metrics in Different Environments
### Overview
The image presents a comparative analysis of spatial exploration behavior across four distinct environments: Corridor, Path, Maze, and Room. Each environment is represented by a heatmap visualizing spatial usage, accompanied by two charts displaying metrics related to exploration – "Metric value" and "MFPT/WHR (normalized)" – plotted against a logarithmic scale of lambda (λ).
### Components/Axes
Each of the four panels (A, B, C, D) shares the same chart structure:
* **Top:** Heatmap representing spatial usage. Color intensity indicates frequency of visits, with blue representing low frequency and red representing high frequency.
* **Middle:** Line chart plotting "Metric value" against λ (log scale). Includes error bars representing fluctuations.
* **Bottom:** Line chart plotting "MFPT/WHR (normalized)" against λ (log scale). Three lines are displayed: MFPT (blue), WHR (red), and Intuition (green). Scatter points are used to represent the data, with lines showing the trend.
* **X-axis (all charts):** λ (log scale), ranging from approximately 10<sup>0</sup> to 10<sup>2</sup>.
* **Y-axis (Middle chart):** Metric value, ranging from approximately 0.8 to 1.4.
* **Y-axis (Bottom chart):** MFPT/WHR (normalized), ranging from approximately 0.2 to 0.8.
* **Legend (Bottom chart):** MFPT (blue line), WHR (red line), Intuition (green line).
* **Inset (Middle chart):** A small plot showing σ (0.05) against η<sub>f</sub>(β<sup>-1</sup>) for λ.
### Detailed Analysis or Content Details
**Panel A: Corridor**
* **Heatmap:** Shows high usage concentrated along a central path, with lower usage on the sides.
* **Metric Value Chart:** The blue line representing the metric value shows a generally upward trend, starting around 0.95 at λ = 10<sup>0</sup> and reaching approximately 1.3 at λ = 10<sup>2</sup>. The error bars (fluctuations) are relatively small.
* **MFPT/WHR Chart:**
* MFPT (blue): Starts around 0.7 at λ = 10<sup>0</sup>, initially increases, then plateaus around 0.65-0.7.
* WHR (red): Starts around 0.5 at λ = 10<sup>0</sup>, decreases to approximately 0.45 at λ = 10<sup>1</sup>, then increases slightly to around 0.5 at λ = 10<sup>2</sup>.
* Intuition (green): Starts around 0.4 at λ = 10<sup>0</sup>, increases rapidly to a peak around 0.6 at λ = 10<sup>1</sup>, then decreases to approximately 0.5 at λ = 10<sup>2</sup>.
**Panel B: Path**
* **Heatmap:** Shows a clear, focused path of high usage.
* **Metric Value Chart:** Similar to the Corridor, the metric value increases with λ, starting around 0.9 and reaching approximately 1.35 at λ = 10<sup>2</sup>. Fluctuations are small.
* **MFPT/WHR Chart:**
* MFPT (blue): Starts around 0.7, increases to approximately 0.75 at λ = 10<sup>1</sup>, then plateaus.
* WHR (red): Starts around 0.5, decreases to approximately 0.4 at λ = 10<sup>1</sup>, then increases slightly.
* Intuition (green): Starts around 0.4, increases to a peak around 0.65 at λ = 10<sup>1</sup>, then decreases.
**Panel C: Maze**
* **Heatmap:** Shows a more dispersed usage pattern, indicative of exploration within a maze structure.
* **Metric Value Chart:** The metric value increases with λ, starting around 0.9 and reaching approximately 1.3 at λ = 10<sup>2</sup>. Fluctuations are slightly larger than in the Corridor and Path.
* **MFPT/WHR Chart:**
* MFPT (blue): Starts around 0.7, increases to approximately 0.75 at λ = 10<sup>1</sup>, then plateaus.
* WHR (red): Starts around 0.5, decreases to approximately 0.4 at λ = 10<sup>1</sup>, then increases slightly.
* Intuition (green): Starts around 0.4, increases to a peak around 0.6 at λ = 10<sup>1</sup>, then decreases.
**Panel D: Room**
* **Heatmap:** Shows a relatively uniform usage pattern across the room.
* **Metric Value Chart:** The metric value increases with λ, starting around 0.9 and reaching approximately 1.3 at λ = 10<sup>2</sup>. Fluctuations are small.
* **MFPT/WHR Chart:**
* MFPT (blue): Starts around 0.7, increases to approximately 0.75 at λ = 10<sup>1</sup>, then plateaus.
* WHR (red): Starts around 0.5, decreases to approximately 0.4 at λ = 10<sup>1</sup>, then increases slightly.
* Intuition (green): Starts around 0.4, increases to a peak around 0.6 at λ = 10<sup>1</sup>, then decreases.
### Key Observations
* The "Metric value" consistently increases with λ across all environments, suggesting a positive correlation between λ and the measured metric.
* The "Intuition" metric consistently peaks around λ = 10<sup>1</sup> in all environments, then declines.
* The "WHR" metric generally decreases initially with increasing λ, then plateaus or slightly increases.
* The heatmaps reveal distinct spatial usage patterns for each environment, reflecting the constraints and opportunities for exploration.
### Interpretation
The data suggests that the parameter λ influences spatial exploration behavior in a consistent manner across different environments. The increasing "Metric value" with λ indicates that as λ increases, the agent explores the environment more thoroughly or efficiently. The peaking of "Intuition" at intermediate values of λ suggests an optimal level of exploration where the agent balances exploration and exploitation. The behavior of "WHR" suggests a trade-off between the time spent in familiar areas and the time spent exploring new areas.
The differences in heatmap patterns highlight the impact of environmental structure on exploration. The focused path in the "Path" environment contrasts with the dispersed pattern in the "Maze" environment, indicating that the agent adapts its exploration strategy to the specific constraints of each environment. The relatively uniform pattern in the "Room" suggests a lack of strong directional biases.
The inset plots showing σ vs η<sub>f</sub>(β<sup>-1</sup>) provide additional information about the fluctuations in the metric value, but their specific meaning requires further context. The consistent shape of these insets across all environments suggests a common underlying mechanism governing the fluctuations.