TECHNICAL ASSET FINGERPRINT
7f46f1f75bcddc1606b4f907
Click to view fullscreen
Press ESC or click to close
FOUND IN PAPERS
EXPERT: healer-alpha-free VERSION 1
RUNTIME: free/openrouter/healer-alpha
INTEL_VERIFIED
## Multi-Panel Scientific Figure: Navigation Metrics Across Environments
### Overview
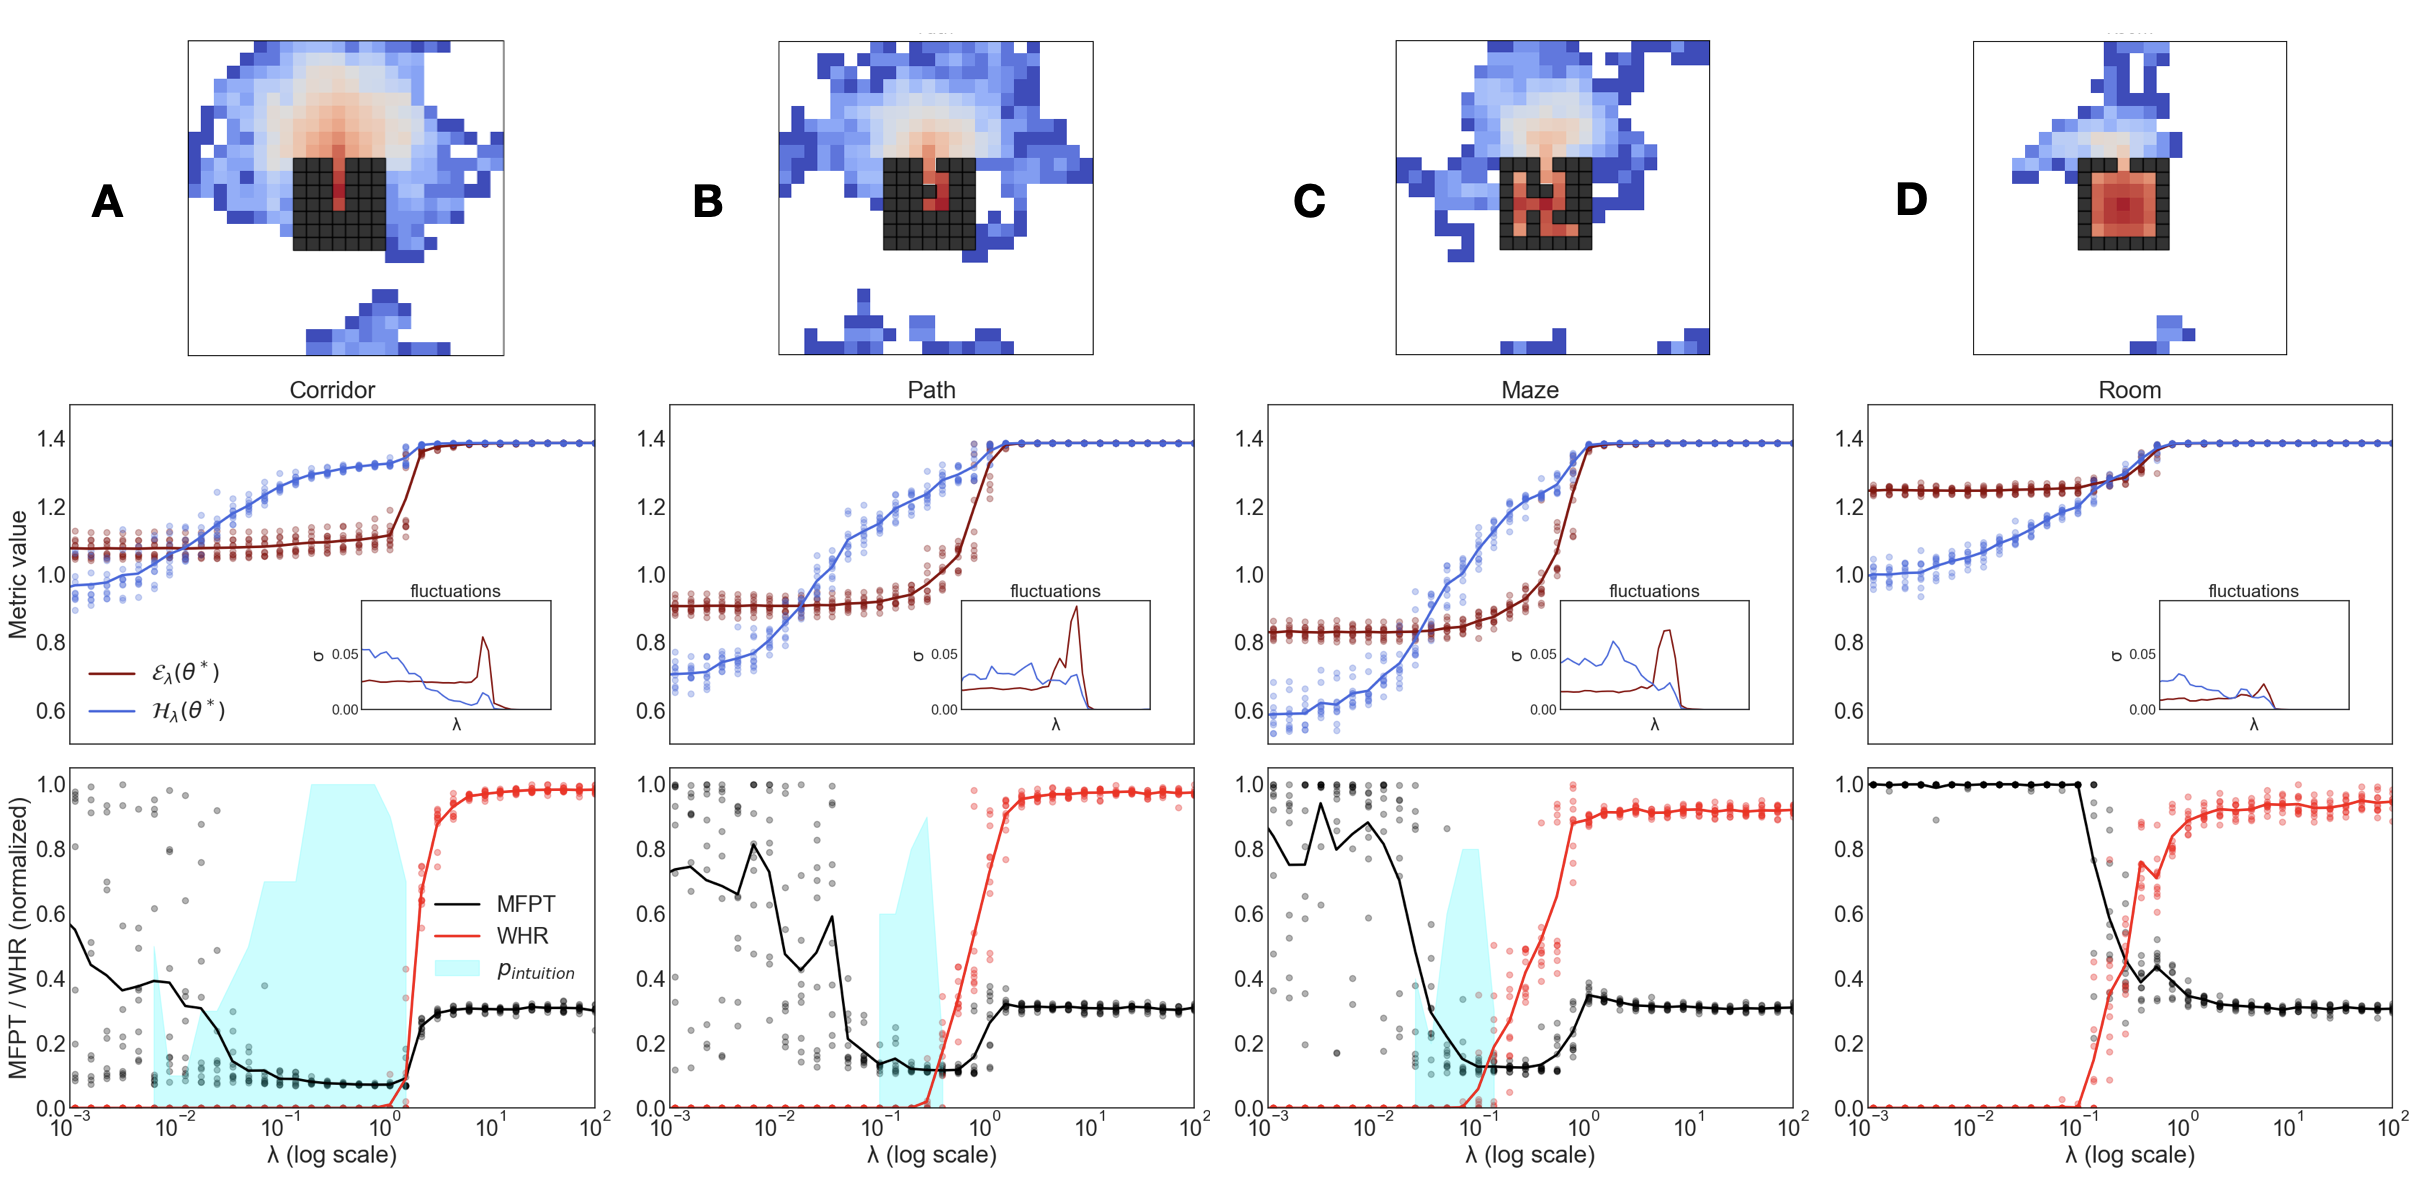
The image is a composite scientific figure containing four columns (labeled A, B, C, D) corresponding to four distinct environments: **Corridor**, **Path**, **Maze**, and **Room**. Each column contains three vertically stacked panels: a top heatmap, a middle line graph with an inset, and a bottom line graph. The figure analyzes the relationship between a parameter `λ` (lambda) and various performance or behavioral metrics across these environments.
### Components/Axes
**Global Structure:**
- **Columns (A-D):** Labeled at the top-left of each column's heatmap. Corresponding environment names are printed below the heatmaps: **Corridor** (A), **Path** (B), **Maze** (C), **Room** (D).
- **Rows:**
1. **Top Row:** Heatmaps showing spatial distributions.
2. **Middle Row:** Line graphs plotting "Metric value" vs. `λ (log scale)`.
3. **Bottom Row:** Line graphs plotting "MFPT / WHR (normalized)" vs. `λ (log scale)`.
**Middle Row Graphs (All Columns):**
| Element | Description |
| :--- | :--- |
| **Y-axis** | Label: "Metric value". Scale: 0.6 to 1.4. |
| **X-axis** | Label: "λ (log scale)". Scale: logarithmic, 10⁻³ to 10². |
| **Legend** | Located at bottom-left of each plot.<br>- Red line: `ε_λ(θ*)`<br>- Blue line: `H_λ(θ*)` |
| **Inset Graph** | Located at bottom-right of each plot.<br>- Title: "fluctuations"<br>- Y-axis: Label "σ". Scale: 0.00 to 0.05.<br>- X-axis: Label "λ". Scale: linear, matching main plot's range.<br>- Contains red and blue lines corresponding to the main plot's metric fluctuations. |
**Bottom Row Graphs (All Columns):**
| Element | Description |
| :--- | :--- |
| **Y-axis** | Label: "MFPT / WHR (normalized)". Scale: 0.0 to 1.0. |
| **X-axis** | Label: "λ (log scale)". Scale: logarithmic, 10⁻³ to 10². |
| **Legend** | Embedded within plot area.<br>- Black line: **MFPT** (Mean First Passage Time)<br>- Red line: **WHR** (Weighted Hit Rate)<br>- Cyan shaded area: **p_intuition** |
| **Data Points** | Scatter points (gray/black for MFPT, red for WHR) overlaid on the lines, indicating individual data samples. |
### Detailed Analysis
**Top Row - Heatmaps:**
- Each heatmap displays a 2D spatial grid. A central black square (likely an obstacle or start zone) is present in all.
- **Color Scale:** Blue to Red/Orange. Blue indicates low values, red/orange indicates high values.
- **Panel A (Corridor):** High values (red/orange) are concentrated in a vertical column above the central block, with a diffuse blue region spreading outward.
- **Panel B (Path):** High values form a narrow, winding path emanating from the central block.
- **Panel C (Maze):** High values are confined to a more complex, maze-like structure around the central block.
- **Panel D (Room):** High values are concentrated in a square "room" shape directly above the central block, with minimal spread.
**Middle Row - Metric Value vs. λ:**
- **Trend for `H_λ(θ*)` (Blue Line):** In all four environments, the blue line shows a consistent **sigmoidal increase**. It starts at a lower value (~0.6-1.0) for small λ (10⁻³), rises steeply between λ ≈ 10⁻¹ and λ ≈ 1, and plateaus at a high value (~1.4) for λ > 1.
- **Trend for `ε_λ(θ*)` (Red Line):** The red line shows a more environment-dependent pattern.
- **Corridor (A):** Remains relatively flat (~1.1) until λ ≈ 1, then jumps sharply to meet the blue line's plateau.
- **Path (B) & Maze (C):** Starts lower (~0.9), increases gradually, then joins the blue plateau around λ ≈ 1.
- **Room (D):** Starts high (~1.25), remains flat, then increases to join the plateau.
- **Inset "fluctuations" (σ):** The standard deviation (σ) for both metrics is generally low (<0.05). A notable peak in σ for the red line (`ε_λ`) occurs around the transition point (λ ≈ 1) in Corridor, Path, and Maze, indicating higher variability during the phase change.
**Bottom Row - MFPT/WHR vs. λ:**
- **Trend for MFPT (Black Line):** Shows a **non-monotonic, U-shaped or decreasing-then-stable** pattern.
- Starts high (~0.6-1.0) at low λ.
- Drops to a minimum around λ ≈ 10⁻¹ to 10⁰.
- Rises slightly and stabilizes at a moderate value (~0.3-0.4) for λ > 1.
- **Trend for WHR (Red Line):** Shows a **sharp, sigmoidal increase**.
- Is near zero for λ < 10⁻¹.
- Increases dramatically between λ ≈ 10⁻¹ and λ ≈ 1.
- Plateaus near 1.0 for λ > 1.
- **Trend for p_intuition (Cyan Shaded Area):** Represents a probability or region of "intuitive" behavior.
- Peaks in the intermediate λ range (λ ≈ 10⁻¹ to 10⁰), precisely where MFPT is minimized and WHR is undergoing its sharp increase.
- The peak is most pronounced and broad in the Corridor (A) and Path (B) environments.
- **Scatter Points:** The gray/black (MFPT) and red (WHR) dots show the spread of individual trial data around the mean lines. The spread is larger at lower λ values, especially for MFPT.
### Key Observations
1. **Phase Transition at λ ≈ 1:** A critical transition occurs around λ = 1 across all metrics and environments. This is where `H_λ` and `ε_λ` plateau, WHR saturates, and MFPT stabilizes.
2. **Environment-Dependent Initial Conditions:** The starting values (at low λ) for `ε_λ` and MFPT vary significantly by environment (e.g., MFPT starts highest in Room, lowest in Maze), reflecting the inherent difficulty or structure of each space.
3. **Optimal Intermediate λ:** The `p_intuition` region and the minimum of MFPT coincide in the intermediate λ range (0.1 - 1), suggesting an optimal parameter zone for efficient navigation.
4. **Consistency of H_λ:** The blue line (`H_λ`) behaves almost identically across all four environments, suggesting it measures a fundamental property that scales uniformly with λ regardless of spatial structure.
### Interpretation
This figure likely comes from a study on **navigation, search strategies, or decision-making in structured environments**, where `λ` is a control parameter balancing exploration and exploitation, or cost and reward.
- **What the data suggests:** The parameter `λ` acts as a "tuning knob." At low `λ`, the agent exhibits inefficient, high-variance behavior (high MFPT, low WHR). As `λ` increases towards 1, the agent undergoes a behavioral phase transition, rapidly adopting an efficient, "intuitive" strategy (peak `p_intuition`, minimal MFPT, surging WHR). At high `λ`, performance saturates (high, stable WHR and `H_λ`), but may become rigid.
- **Relationship between elements:** The top heatmaps visualize the *spatial outcome* of the strategies quantified below. The narrow path in B vs. the room in D explains why the initial `ε_λ` and MFPT differ—the agent's default policy is already more effective in a simple room than a complex path. The middle graphs show the convergence of two information-theoretic or energy-based metrics (`ε_λ`, `H_λ`), while the bottom graphs link this to concrete performance (MFPT, WHR).
- **Notable Anomalies/Patterns:** The sharp peak in fluctuation (`σ`) for `ε_λ` at the transition point is a classic signature of a critical phase change, where the system is most sensitive. The near-perfect inverse relationship between the WHR rise and the MFPT fall highlights a direct trade-off between hitting targets quickly and the time taken to find them.
**In summary, the figure demonstrates that navigating complex environments optimally requires tuning a parameter `λ` to an intermediate "critical" region, where a transition from exploratory to exploitative behavior occurs, maximizing intuitive efficiency.**
DECODING INTELLIGENCE...