## Heatmap and Subplot Analysis: Environmental Metric Evaluation
### Overview
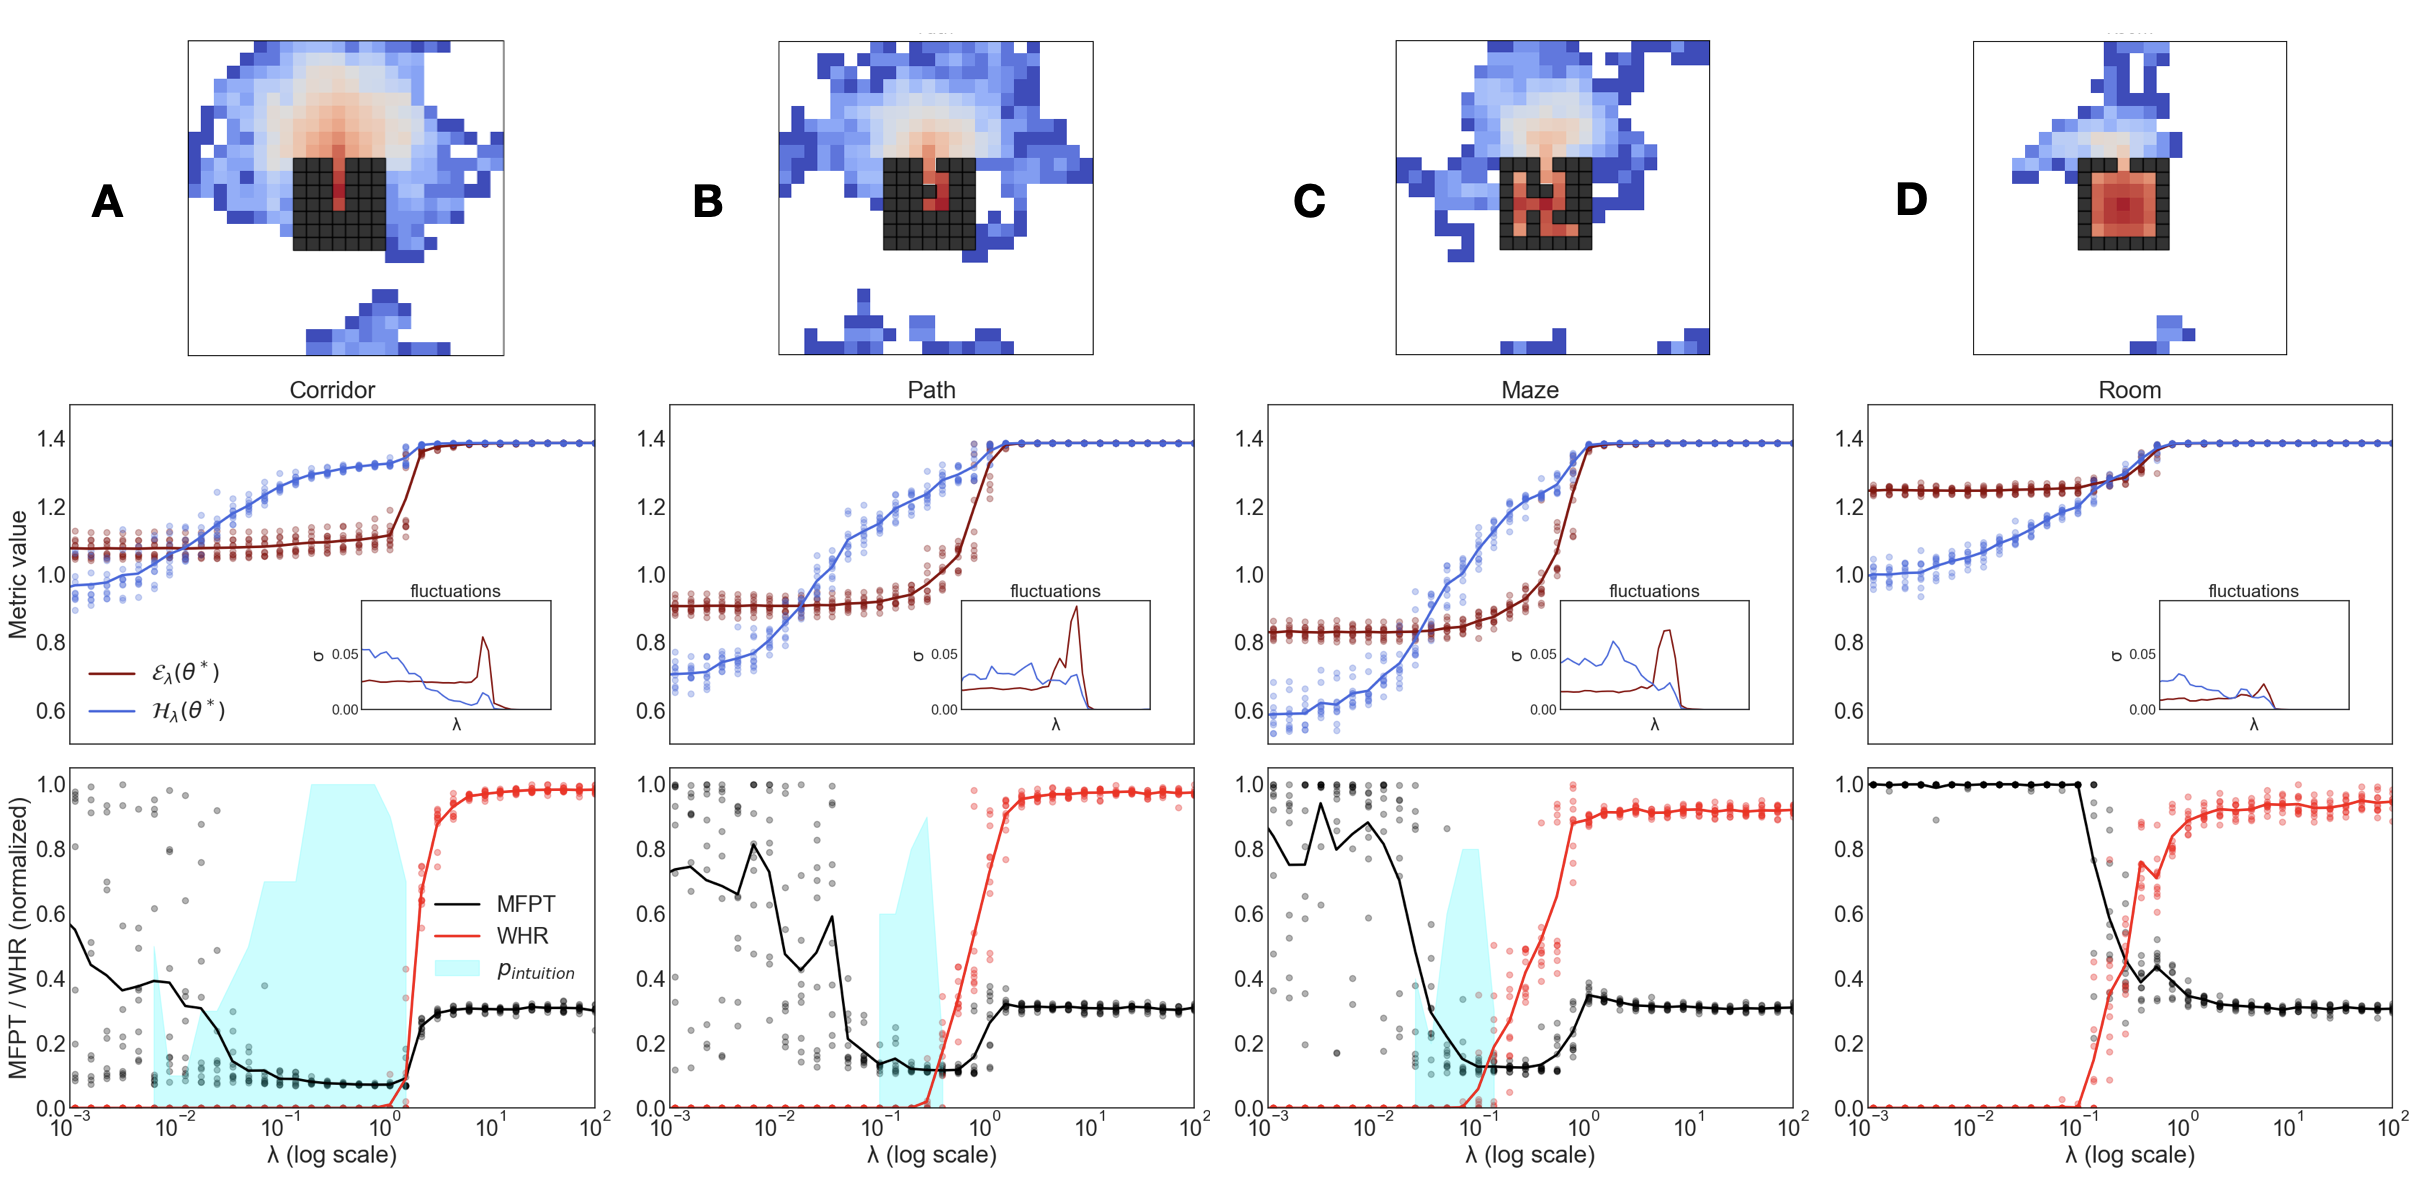
The image presents four environmental configurations (A-D: Corridor, Path, Maze, Room) with associated heatmaps and three subplots per configuration. Each configuration includes:
1. A heatmap visualization with grid-based spatial distribution
2. Three subplots showing metric evolution across λ values
3. Legend elements and fluctuation insets
### Components/Axes
**Heatmap Elements:**
- Grid-based spatial distribution with red/blue color coding
- Central "obstacle" structure in each configuration
- Labels A-D for configurations
**Subplot 1 (Top):**
- Y-axis: Metric value (0.6-1.4)
- X-axis: λ (log scale, 10^-3 to 10^2)
- Lines:
- Red: Eλ(θ*) (mean metric value)
- Blue: Hλ(θ*) (fluctuation metric)
**Subplot 2 (Middle):**
- Same axes as Subplot 1
- Inset: Fluctuation distribution (σ vs λ)
- σ range: 0.00-0.05
**Subplot 3 (Bottom):**
- Y-axis: MFPT/WHR (normalized, 0-1)
- X-axis: λ (log scale, 10^-3 to 10^2)
- Data points:
- Black: MFPT (Mean First Passage Time)
- Red: WHR (Wandering Home Ratio)
- Shaded area: P_intuition (intuition probability)
### Detailed Analysis
**Heatmap Patterns:**
- A (Corridor): Central red cluster with blue periphery
- B (Path): Concentrated red core with radial blue distribution
- C (Maze): Fragmented red regions with complex blue network
- D (Room): Compact red core with minimal blue extension
**Subplot 1 Trends:**
- All configurations show:
- Red line (Eλ) increasing with λ, plateauing near 1.4
- Blue line (Hλ) following similar trend with higher variance
- Notable σ peaks at λ≈10^-1 in all cases
**Subplot 3 Patterns:**
- MFPT (black):
- Sharp decline at λ=10^-1
- Stabilizes near 0.2 for λ≥10^0
- WHR (red):
- Gradual increase until λ=10^0
- Sharp rise to 1.0 for λ≥10^1
- P_intuition (cyan):
- Peaks at λ=10^-1 across all configurations
### Key Observations
1. Environmental complexity correlates with:
- Increased metric fluctuations (σ peaks at λ=10^-1)
- More pronounced intuition probability peaks
2. WHR shows stronger λ dependence than MFPT
3. Maze configuration (C) exhibits most complex spatial distribution
4. Room configuration (D) demonstrates most stable metric behavior
### Interpretation
The data suggests that:
- λ=10^-1 represents a critical threshold where:
- Metric fluctuations peak (σ)
- Intuition probability maximizes (P_intuition)
- WHR begins rapid increase
- Maze environments create most spatially complex metric distributions
- Room environments show most stable metric behavior across λ values
- The relationship between spatial configuration and metric evolution indicates that:
- Lower λ values (10^-3 to 10^-1) capture environmental sensitivity
- Higher λ values (10^0 to 10^2) reflect stabilized behavioral patterns
- The intuition probability (P_intuition) appears to predict significant behavioral transitions at λ=10^-1
*Note: All values are approximate due to image resolution constraints. σ values in fluctuation insets show consistent peak magnitude (~0.05) across configurations.*