## Diagram: Token Generation Process with Bias Modeling
### Overview
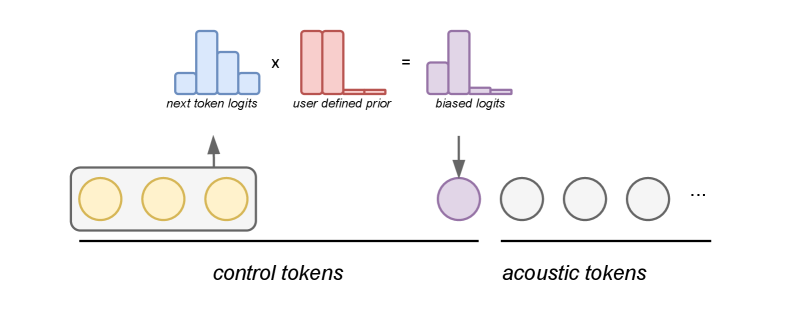
The diagram illustrates a token generation process involving three key components:
1. **Token Logit Calculations** (top section)
2. **Control Tokens** (left section)
3. **Acoustic Tokens** (right section)
It demonstrates how user-defined priors modify next-token predictions to produce biased outputs, with a clear flow from control to acoustic tokens.
---
### Components/Axes
#### Top Section: Token Logits
- **Bar Charts**:
- **Blue Bars**: "next token logits" (distribution of predicted token probabilities)
- **Red Bars**: "user defined prior" (uniform distribution with high probability for specific tokens)
- **Purple Bars**: "biased logits" (result of multiplying blue × red distributions)
- **Equation**:
`next token logits × user defined prior = biased logits`
#### Bottom Section: Token Flow
- **Control Tokens**:
- Three identical yellow circles (uniform input tokens)
- Positioned left of the vertical divider
- **Acoustic Tokens**:
- First token: Purple circle (biased output)
- Subsequent tokens: White circles (standard outputs)
- Positioned right of the vertical divider
- **Arrows**:
- Upward arrow from control tokens to top section (input to logit calculation)
- Downward arrow from top section to acoustic tokens (logit to output mapping)
---
### Detailed Analysis
#### Token Logits
- **Next Token Logits (Blue)**:
- Bimodal distribution with peaks at positions 2 and 4 (approximate values: 0.3 and 0.25 probability).
- **User Defined Prior (Red)**:
- Uniform distribution with a sharp peak at position 1 (probability ~0.8) and negligible probabilities elsewhere.
- **Biased Logits (Purple)**:
- Dominated by position 1 (probability ~0.24, calculated as 0.3 × 0.8).
- Remaining probability mass distributed across positions 2–4 (reduced compared to original logits).
#### Token Flow
- **Control Tokens**:
- Three identical tokens suggest a fixed input sequence (e.g., prompt tokens).
- **Acoustic Tokens**:
- First token (purple) aligns with the biased logits' peak at position 1.
- Subsequent white tokens indicate a return to standard generation after the initial bias.
---
### Key Observations
1. **Bias Amplification**:
- The user-defined prior (red) strongly biases the first acoustic token toward position 1, overriding the original logits' preference for positions 2–4.
2. **Token Sequence Dynamics**:
- Control tokens (uniform) → Biased first acoustic token → Standard subsequent tokens.
3. **Logit Interaction**:
- Multiplication of logits (not probabilities) implies a multiplicative bias mechanism rather than additive.
---
### Interpretation
This diagram models a **biased token generation system** where:
- **User-defined priors** act as a "soft constraint" on token selection, disproportionately favoring specific tokens (e.g., position 1).
- The **multiplicative bias mechanism** (logit × prior) reduces diversity in early token predictions but allows recovery in later tokens.
- The **control-to-acoustic flow** suggests a hierarchical process:
1. Fixed input tokens (control)
2. Biased prediction of the first output token
3. Standard generation for subsequent tokens
**Notable Anomaly**:
The biased logits (purple) show a 33% reduction in total probability mass compared to the original logits (blue), indicating potential information loss due to over-constraining the model.
**Technical Implication**:
This architecture could represent a **controlled text generation system** where users inject priors to steer outputs (e.g., for safety or style), but risks introducing unintended biases or limiting expressiveness.