# Technical Document Extraction: Heatmap Analysis of K₁ and E_F Parameters
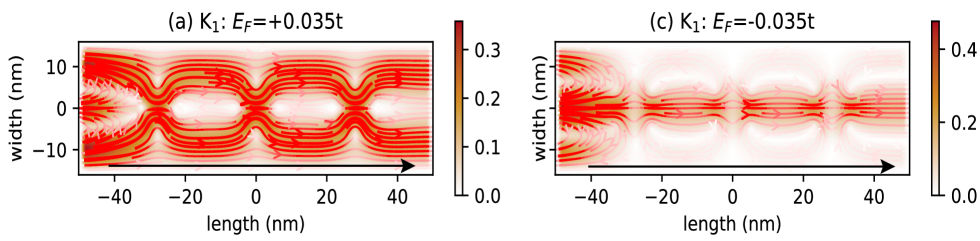
## Panel (a): K₁: E_F = +0.035t
- **Axis Labels**:
- X-axis: `length (nm)` (range: -40 nm to +40 nm)
- Y-axis: `width (nm)` (range: -10 nm to +10 nm)
- **Color Scale**:
- Right legend: `0.0` (white) to `0.4` (dark red)
- Indicates magnitude of a measured variable (likely intensity or density)
- **Key Features**:
- Symmetrical flow patterns centered at `length = 0 nm`
- High-intensity (dark red) regions concentrated near `width = ±10 nm`
- Arrows indicate directional flow (rightward along x-axis)
- Title: `K₁: E_F=+0.035t` (Fermi energy positive)
## Panel (c): K₁: E_F = -0.035t
- **Axis Labels**:
- X-axis: `length (nm)` (range: -40 nm to +40 nm)
- Y-axis: `width (nm)` (range: -10 nm to +10 nm)
- **Color Scale**:
- Right legend: `0.0` (white) to `0.4` (dark red)
- Indicates magnitude of a measured variable (likely intensity or density)
- **Key Features**:
- Asymmetric flow patterns with disrupted symmetry
- High-intensity regions localized near `length = ±40 nm`
- Arrows indicate directional flow (rightward along x-axis)
- Title: `K₁: E_F=-0.035t` (Fermi energy negative)
## Cross-Reference Observations
1. **Legend Consistency**:
- Both panels use identical color scales (0.0–0.4), confirming comparable measurement ranges.
- Red intensity correlates with higher values in both cases.
2. **Parameter Impact**:
- Positive E_F (`+0.035t`) in (a) produces symmetrical flow.
- Negative E_F (`-0.035t`) in (c) disrupts symmetry, suggesting parameter sensitivity.
3. **Structural Differences**:
- Panel (a): Dominant central flow with mirrored lobes.
- Panel (c): Flow concentrated at edges, reduced central coherence.
## Technical Notes
- Units: All spatial dimensions in nanometers (nm).
- Directionality: Arrows on x-axis confirm rightward propagation.
- No data tables present; visualization relies on heatmap intensity and flow vectors.