## Line Chart: RL Training Performance
### Overview
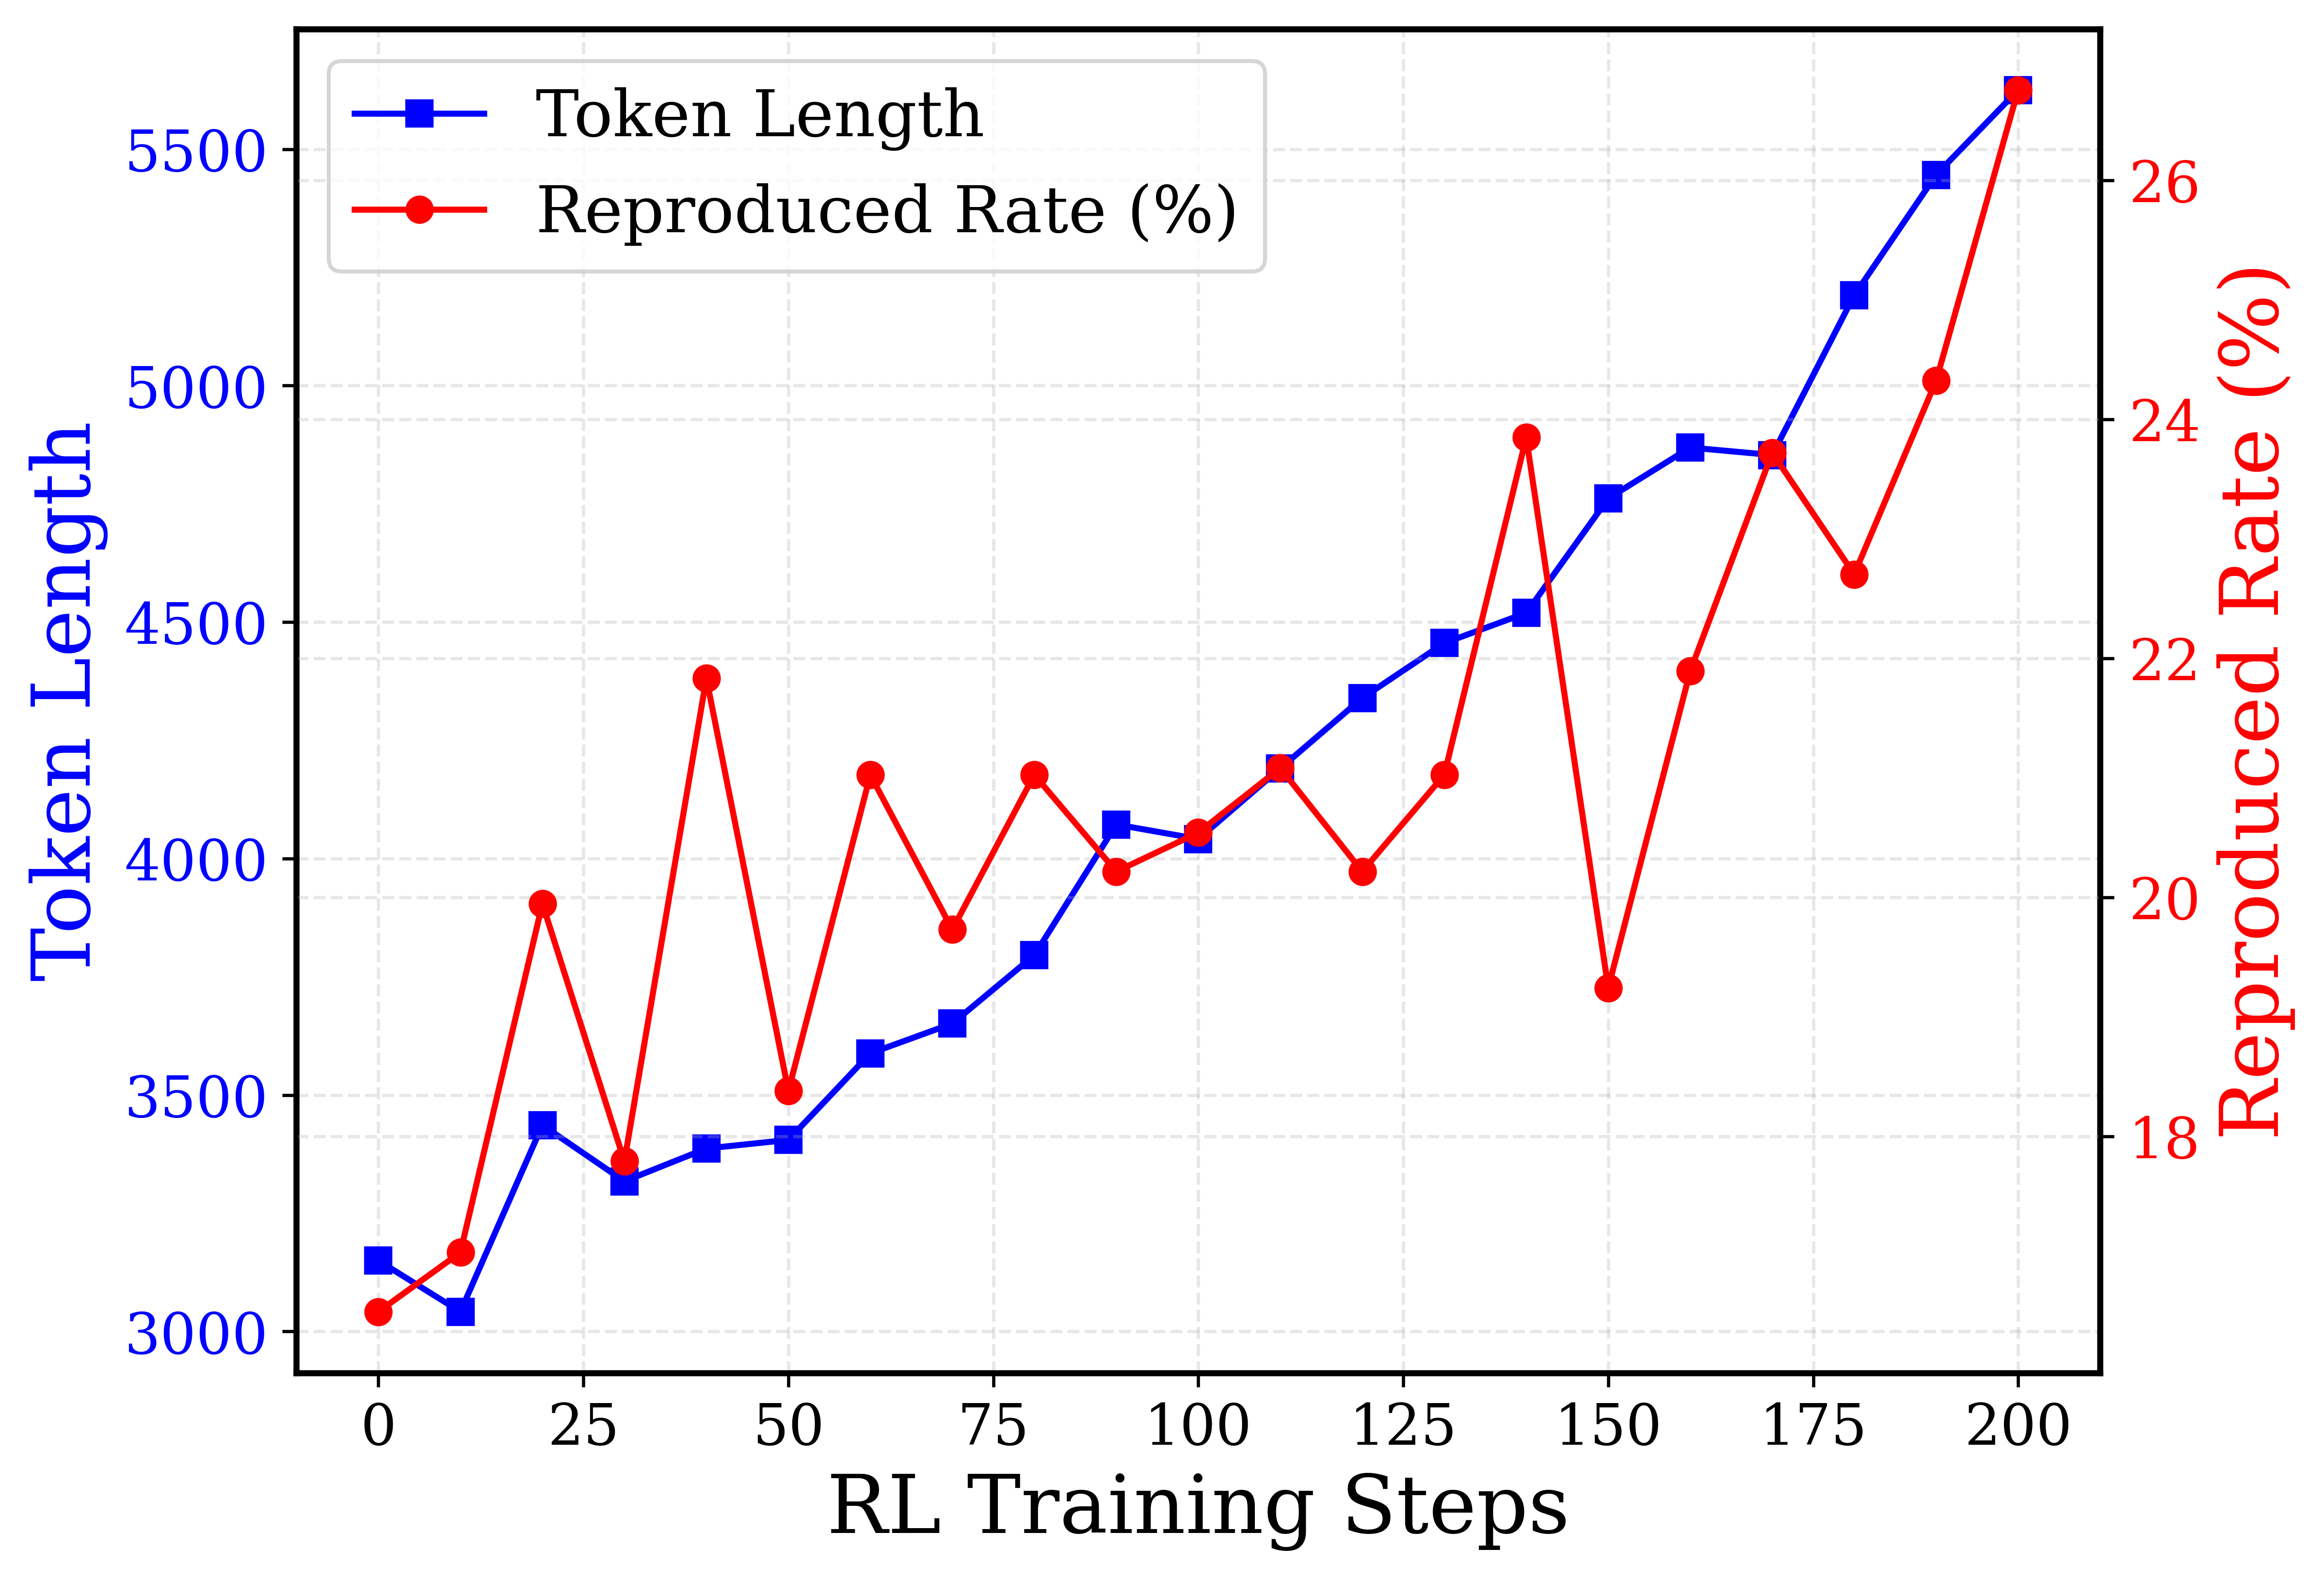
This image presents a line chart illustrating the relationship between RL Training Steps and two performance metrics: Token Length and Reproduced Rate (%). The chart displays how these metrics evolve over 200 training steps. The Token Length is plotted on the primary y-axis (left), while the Reproduced Rate (%) is plotted on the secondary y-axis (right).
### Components/Axes
* **X-axis:** RL Training Steps, ranging from 0 to 200, with markers at intervals of 25.
* **Primary Y-axis (Left):** Token Length, ranging from 3000 to 5500, with markers at intervals of 500.
* **Secondary Y-axis (Right):** Reproduced Rate (%), ranging from 18% to 26%, with markers at intervals of 2%.
* **Legend:** Located in the top-left corner.
* Blue line with square markers: "Token Length"
* Red line with circular markers: "Reproduced Rate (%)"
* **Gridlines:** Light gray, providing a visual aid for reading values.
### Detailed Analysis
**Token Length (Blue Line):**
The Token Length line generally slopes upward, indicating an increasing token length as training progresses.
* At 0 RL Training Steps, the Token Length is approximately 3000.
* At 25 RL Training Steps, the Token Length is approximately 3200.
* At 50 RL Training Steps, the Token Length is approximately 3900.
* At 75 RL Training Steps, the Token Length is approximately 4000.
* At 100 RL Training Steps, the Token Length is approximately 4200.
* At 125 RL Training Steps, the Token Length is approximately 4300.
* At 150 RL Training Steps, the Token Length is approximately 4400.
* At 175 RL Training Steps, the Token Length is approximately 5200.
* At 200 RL Training Steps, the Token Length is approximately 5400.
**Reproduced Rate (%) (Red Line):**
The Reproduced Rate line exhibits more fluctuation, with peaks and valleys throughout the training process.
* At 0 RL Training Steps, the Reproduced Rate is approximately 19%.
* At 25 RL Training Steps, the Reproduced Rate is approximately 23%.
* At 50 RL Training Steps, the Reproduced Rate is approximately 21%.
* At 75 RL Training Steps, the Reproduced Rate is approximately 20%.
* At 100 RL Training Steps, the Reproduced Rate is approximately 21%.
* At 125 RL Training Steps, the Reproduced Rate is approximately 22%.
* At 150 RL Training Steps, the Reproduced Rate is approximately 24%.
* At 175 RL Training Steps, the Reproduced Rate is approximately 23%.
* At 200 RL Training Steps, the Reproduced Rate is approximately 25%.
### Key Observations
* The Token Length consistently increases over the 200 training steps, suggesting the model is learning to generate longer sequences.
* The Reproduced Rate fluctuates significantly, indicating variability in the model's ability to reproduce the desired output. There is a general upward trend, but with considerable noise.
* The peak Reproduced Rate occurs around 50 RL Training Steps, reaching approximately 25%.
* The lowest Reproduced Rate occurs around 75 RL Training Steps, at approximately 20%.
* The Token Length and Reproduced Rate do not appear to be directly correlated. For example, the Token Length increases steadily while the Reproduced Rate fluctuates.
### Interpretation
The chart suggests that as the RL agent trains, it learns to generate longer token sequences (Token Length). However, the quality of reproduction (Reproduced Rate) is not consistently improving and exhibits significant variability. This could indicate that while the model is becoming more fluent in generating text, it is not necessarily becoming more accurate or faithful to the desired output. The fluctuations in Reproduced Rate might be due to the stochastic nature of the RL algorithm or the complexity of the task. Further investigation is needed to understand the factors contributing to the variability in the Reproduced Rate and to determine whether the increasing Token Length is accompanied by a corresponding improvement in the quality of the generated text. The divergence between the two metrics suggests a potential trade-off between length and accuracy, which could be a focus for future optimization efforts.