## Line Graph: Llama-3.1-8B Performance Over Iterations
### Overview
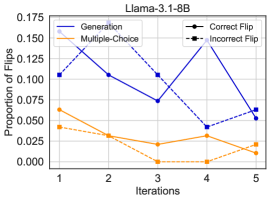
The graph illustrates the proportion of "Flips" (changes in model outputs) across five iterations for four distinct model behaviors: Generation, Multiple-Choice, Correct Flip, and Incorrect Flip. Data is visualized using four distinct lines with markers.
### Components/Axes
- **X-axis (Iterations)**: Discrete values 1–5, labeled "Iterations".
- **Y-axis (Proportion of Flips)**: Continuous scale from 0.000 to 0.175, labeled "Proportion of Flips".
- **Legend**: Positioned at the top-right corner, with four entries:
- **Generation**: Solid blue line with square markers.
- **Multiple-Choice**: Dashed orange line with square markers.
- **Correct Flip**: Solid black line with circle markers.
- **Incorrect Flip**: Dashed black line with circle markers.
### Detailed Analysis
1. **Generation (Blue Solid Line)**:
- Iteration 1: ~0.105
- Iteration 2: Peaks at ~0.175
- Iteration 3: Drops to ~0.075
- Iteration 4: Rises to ~0.15
- Iteration 5: Declines to ~0.055
- *Trend*: Volatile, with a peak in iteration 2 and a general decline afterward.
2. **Multiple-Choice (Orange Dashed Line)**:
- Iteration 1: ~0.06
- Iteration 2: ~0.04
- Iteration 3: ~0.025
- Iteration 4: ~0.03
- Iteration 5: ~0.02
- *Trend*: Steady decline with minor fluctuations.
3. **Correct Flip (Black Solid Line)**:
- Iteration 1: ~0.025
- Iteration 2: ~0.01
- Iteration 3: ~0.005
- Iteration 4: ~0.02
- Iteration 5: ~0.02
- *Trend*: Minimal values, slight recovery in later iterations.
4. **Incorrect Flip (Black Dashed Line)**:
- Iteration 1: ~0.15
- Iteration 2: Peaks at ~0.175
- Iteration 3: Drops to ~0.125
- Iteration 4: Rises to ~0.15
- Iteration 5: Declines to ~0.05
- *Trend*: Inverse relationship with Generation; peaks in iterations 2 and 4.
### Key Observations
- **Inverse Correlation**: Generation and Incorrect Flip trends are nearly opposite (e.g., Generation peaks at iteration 2, while Incorrect Flip peaks there too, but declines as Generation recovers in iteration 4).
- **Stability**: Multiple-Choice flips remain consistently low (<0.06), suggesting minimal variability in this behavior.
- **Outliers**: Correct Flip values are orders of magnitude lower than other categories, indicating rare or negligible occurrences.
### Interpretation
The data suggests that the Llama-3.1-8B model exhibits significant variability in "Generation" and "Incorrect Flip" behaviors across iterations, with a notable inverse relationship between these two metrics. The stability of Multiple-Choice flips implies robustness in this specific task. The persistently low Correct Flip values may indicate limitations in the model's ability to consistently align with expected outputs, warranting further investigation into training data or architectural adjustments. The volatility in Generation flips could reflect dynamic adaptation to input variations, while the cyclical pattern in Incorrect Flips might highlight recurring error modes.