## Chart: Llama-3.1-8B Proportion of Flips
### Overview
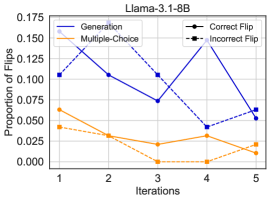
The image is a line chart comparing the proportion of flips across iterations for two different methods: Generation and Multiple-Choice. It also distinguishes between Correct and Incorrect Flips. The chart shows how the proportion of flips changes over five iterations for each method.
### Components/Axes
* **Title:** Llama-3.1-8B
* **Y-axis:** Proportion of Flips (scale from 0.000 to 0.175, increments of 0.025)
* **X-axis:** Iterations (1 to 5, increments of 1)
* **Legend:** Located at the top-left of the chart.
* **Generation:** Solid dark blue line
* **Multiple-Choice:** Solid orange line
* **Correct Flip:** Dashed dark blue line with square markers
* **Incorrect Flip:** Dashed orange line with square markers
### Detailed Analysis
* **Generation (Solid Dark Blue):**
* Iteration 1: Approximately 0.105
* Iteration 2: Approximately 0.105
* Iteration 3: Approximately 0.075
* Iteration 4: Approximately 0.040
* Iteration 5: Approximately 0.055
* Trend: Decreases from iteration 1 to 4, then slightly increases at iteration 5.
* **Multiple-Choice (Solid Orange):**
* Iteration 1: Approximately 0.065
* Iteration 2: Approximately 0.030
* Iteration 3: Approximately 0.020
* Iteration 4: Approximately 0.030
* Iteration 5: Approximately 0.020
* Trend: Decreases from iteration 1 to 3, then slightly increases at iteration 4, then decreases at iteration 5.
* **Correct Flip (Dashed Dark Blue with Square Markers):**
* Iteration 1: Approximately 0.110
* Iteration 2: Approximately 0.105
* Iteration 3: Approximately 0.105
* Iteration 4: Approximately 0.145
* Iteration 5: Approximately 0.065
* Trend: Relatively stable from iteration 1 to 3, increases sharply at iteration 4, then decreases at iteration 5.
* **Incorrect Flip (Dashed Orange with Square Markers):**
* Iteration 1: Approximately 0.040
* Iteration 2: Approximately 0.030
* Iteration 3: Approximately 0.000
* Iteration 4: Approximately 0.030
* Iteration 5: Approximately 0.010
* Trend: Decreases from iteration 1 to 3, then increases at iteration 4, then decreases at iteration 5.
### Key Observations
* The "Generation" method starts with a higher proportion of flips compared to "Multiple-Choice," but the proportion decreases over iterations.
* The "Correct Flip" proportion peaks at iteration 4.
* The "Incorrect Flip" proportion is generally lower than the "Correct Flip" proportion.
### Interpretation
The chart illustrates the performance of the Llama-3.1-8B model in terms of the proportion of flips across different iterations for two methods, "Generation" and "Multiple-Choice," while also distinguishing between "Correct" and "Incorrect" flips. The data suggests that the "Generation" method initially results in a higher proportion of flips, but this decreases over iterations, potentially indicating a learning or stabilization process. The "Multiple-Choice" method consistently shows a lower proportion of flips. The "Correct Flip" proportion peaking at iteration 4 could indicate a point of significant adjustment or learning within the model. The lower proportion of "Incorrect Flips" suggests that the model is generally making more correct adjustments than incorrect ones. The relationship between the elements shows how the model's behavior changes over time and across different methods, highlighting the dynamics of the learning process.