\n
## Line Chart: Proportion of Flips vs. Iterations for Llama-3.1-8B
### Overview
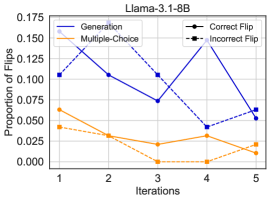
This line chart displays the proportion of flips across different iterations for the Llama-3.1-8B model, comparing "Generation", "Multiple-Choice", "Correct Flip", and "Incorrect Flip" methods. The x-axis represents iterations (1 to 5), and the y-axis represents the proportion of flips, ranging from 0.000 to 0.175.
### Components/Axes
* **Title:** Llama-3.1-8B
* **X-axis Label:** Iterations (with markers at 1, 2, 3, 4, 5)
* **Y-axis Label:** Proportion of Flips (with markers at 0.000, 0.025, 0.050, 0.075, 0.100, 0.125, 0.150, 0.175)
* **Legend:**
* Generation (Solid Blue Line)
* Multiple-Choice (Solid Orange Line)
* Correct Flip (Black Dashed-Dot Line)
* Incorrect Flip (Black Dashed Line)
### Detailed Analysis
* **Generation (Solid Blue Line):** This line exhibits a fluctuating trend. It starts at approximately 0.130 at Iteration 1, decreases to around 0.070 at Iteration 3, rises sharply to approximately 0.160 at Iteration 4, and then drops to around 0.050 at Iteration 5.
* Iteration 1: ~0.130
* Iteration 2: ~0.100
* Iteration 3: ~0.070
* Iteration 4: ~0.160
* Iteration 5: ~0.050
* **Multiple-Choice (Solid Orange Line):** This line shows a generally decreasing trend. It begins at approximately 0.040 at Iteration 1, decreases to around 0.020 at Iteration 3, and fluctuates around 0.025-0.030 for Iterations 4 and 5.
* Iteration 1: ~0.040
* Iteration 2: ~0.030
* Iteration 3: ~0.020
* Iteration 4: ~0.025
* Iteration 5: ~0.030
* **Correct Flip (Black Dashed-Dot Line):** This line starts at approximately 0.110 at Iteration 1, decreases to around 0.080 at Iteration 3, and then rises to approximately 0.100 at Iteration 5.
* Iteration 1: ~0.110
* Iteration 2: ~0.090
* Iteration 3: ~0.080
* Iteration 4: ~0.090
* Iteration 5: ~0.100
* **Incorrect Flip (Black Dashed Line):** This line begins at approximately 0.110 at Iteration 1, decreases to around 0.060 at Iteration 4, and then rises to approximately 0.080 at Iteration 5.
* Iteration 1: ~0.110
* Iteration 2: ~0.080
* Iteration 3: ~0.110
* Iteration 4: ~0.060
* Iteration 5: ~0.080
### Key Observations
* The "Generation" method exhibits the most significant fluctuations in the proportion of flips, with a large increase at Iteration 4.
* The "Multiple-Choice" method shows a consistent downward trend, indicating a decreasing proportion of flips over iterations.
* "Correct Flip" and "Incorrect Flip" show relatively stable trends, with some fluctuations.
* The "Generation" method consistently has a higher proportion of flips compared to the "Multiple-Choice" method.
### Interpretation
The chart suggests that the "Generation" method is more sensitive to changes across iterations, as evidenced by its fluctuating proportion of flips. The decreasing trend in the "Multiple-Choice" method might indicate that the model is becoming more confident in its choices over time, leading to fewer flips. The relatively stable trends in "Correct Flip" and "Incorrect Flip" suggest that the model's ability to identify and correct errors remains consistent throughout the iterations. The large increase in "Generation" flips at Iteration 4 could be an anomaly or a sign of a significant shift in the model's behavior at that point. Further investigation would be needed to determine the cause of this spike. The data demonstrates the dynamic nature of the model's learning process and the varying impact of different methods on its internal state, as measured by the proportion of flips. The "flips" likely represent changes in the model's internal parameters or decision-making process during each iteration.