## Line Chart: Llama-3.1-8B Performance Metrics
### Overview
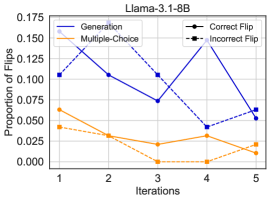
The image is a line chart titled "Llama-3.1-8B" that plots the "Proportion of flips" against "Iterations" (1 through 5). It compares two primary methods ("Generation" and "Multiple-Choice") and tracks two types of "flips" ("Correct Flip" and "Incorrect Flip") associated with them. The chart uses a combination of solid and dashed lines with distinct colors to differentiate the four data series.
### Components/Axes
* **Title:** "Llama-3.1-8B" (Top center).
* **Y-Axis:** Labeled "Proportion of flips". Scale ranges from 0.000 to 0.175, with major tick marks at 0.000, 0.025, 0.050, 0.075, 0.100, 0.125, 0.150, and 0.175.
* **X-Axis:** Labeled "Iterations". Discrete values marked at 1, 2, 3, 4, and 5.
* **Legend:** Located in the top-right corner of the plot area. It defines four series:
* `Generation`: Solid blue line.
* `Multiple-Choice`: Solid orange line.
* `Correct Flip`: Dashed blue line with circle markers.
* `Incorrect Flip`: Dashed orange line with circle markers.
### Detailed Analysis
**Data Series Trends & Approximate Values:**
1. **Generation (Solid Blue Line):**
* **Trend:** Volatile. Starts high, dips, peaks sharply, then falls.
* **Data Points (Approx.):**
* Iteration 1: ~0.155
* Iteration 2: ~0.105
* Iteration 3: ~0.075
* Iteration 4: ~0.150 (Peak)
* Iteration 5: ~0.055
2. **Multiple-Choice (Solid Orange Line):**
* **Trend:** Generally decreasing with a slight uptick at the end.
* **Data Points (Approx.):**
* Iteration 1: ~0.065
* Iteration 2: ~0.035
* Iteration 3: ~0.025
* Iteration 4: ~0.000 (Minimum)
* Iteration 5: ~0.025
3. **Correct Flip (Dashed Blue Line with Circles):**
* **Trend:** U-shaped. Starts high, drops to a minimum, then rises again.
* **Data Points (Approx.):**
* Iteration 1: ~0.155 (Matches Generation start)
* Iteration 2: ~0.105 (Matches Generation at I2)
* Iteration 3: ~0.105
* Iteration 4: ~0.040
* Iteration 5: ~0.075
4. **Incorrect Flip (Dashed Orange Line with Circles):**
* **Trend:** Consistently decreasing.
* **Data Points (Approx.):**
* Iteration 1: ~0.065 (Matches Multiple-Choice start)
* Iteration 2: ~0.035 (Matches Multiple-Choice at I2)
* Iteration 3: ~0.025 (Matches Multiple-Choice at I3)
* Iteration 4: ~0.000 (Matches Multiple-Choice at I4)
* Iteration 5: ~0.000
### Key Observations
1. **Convergence at Start:** At Iteration 1, the "Generation" line and the "Correct Flip" line originate from the same point (~0.155). Similarly, the "Multiple-Choice" line and the "Incorrect Flip" line start together (~0.065).
2. **Divergence of Flips:** After Iteration 2, the "Correct Flip" (dashed blue) and "Incorrect Flip" (dashed orange) lines diverge from their solid-line counterparts. The "Correct Flip" proportion remains significantly higher than the "Incorrect Flip" proportion from Iteration 3 onward.
3. **Peak and Trough:** The "Generation" method shows a dramatic peak at Iteration 4, while the "Multiple-Choice" method hits its lowest point at the same iteration.
4. **Final State:** By Iteration 5, the "Incorrect Flip" proportion has dropped to near zero, while the "Correct Flip" proportion has recovered to a moderate level (~0.075). The "Generation" proportion ends lower than its peak but higher than the "Multiple-Choice" proportion.
### Interpretation
This chart appears to analyze the behavior of a language model (Llama-3.1-8B) over successive iterations of a process, likely involving self-correction or refinement ("flips").
* **Method Comparison:** The "Generation" method exhibits higher volatility and a higher peak proportion of flips compared to the more stable and generally lower "Multiple-Choice" method. This suggests the Generation approach may involve more frequent or dramatic changes between iterations.
* **Flip Analysis:** The divergence between "Correct Flip" and "Incorrect Flip" is critical. The consistently higher rate of "Correct Flips" indicates that when the model changes its output (flips), it is more likely to be moving towards a correct answer than an incorrect one, especially in later iterations. The near-zero "Incorrect Flip" rate by the end suggests the process effectively minimizes erroneous changes over time.
* **Process Dynamics:** The U-shape of the "Correct Flip" line and the peak in "Generation" at Iteration 4 could indicate a phase of intensive correction or exploration in the middle of the process, which then stabilizes. The initial alignment of the solid and dashed lines suggests that in early iterations, all flips are categorized as either correct or incorrect for their respective methods, but the tracking becomes distinct as the process evolves.
**Language:** All text in the image is in English.