## Multiple Line Charts: Performance Comparison of LLM-SR and PIT-PO
### Overview
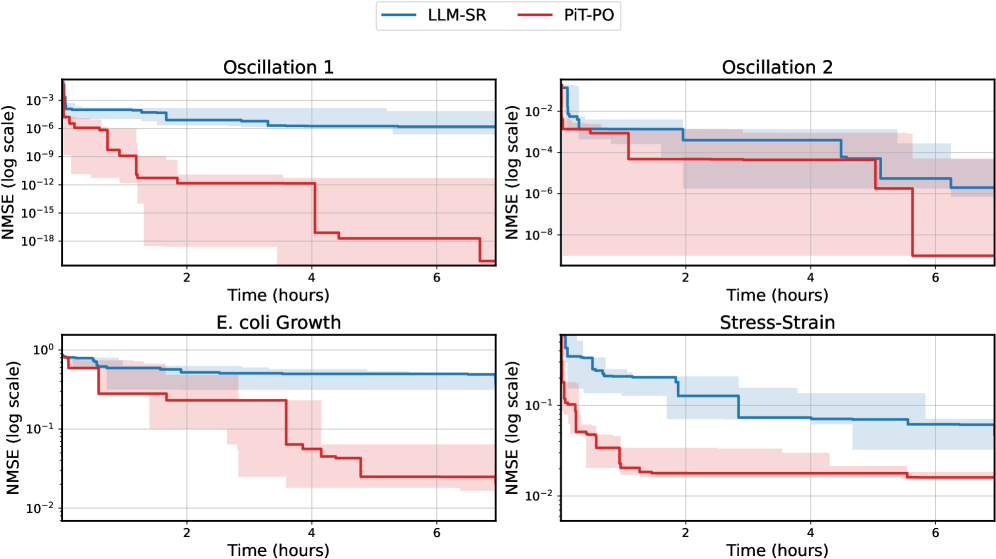
The image contains four line charts arranged in a 2x2 grid. Each chart compares the performance of two methods, LLM-SR (blue line) and PIT-PO (red line), over time (in hours). The y-axis represents the NMSE (Normalized Mean Squared Error) on a logarithmic scale. The charts depict the performance on different tasks: "Oscillation 1", "Oscillation 2", "E. coli Growth", and "Stress-Strain". Each line has a shaded region around it, representing the uncertainty or variability in the data.
### Components/Axes
* **Legend:** Located at the top of the image.
* LLM-SR: Blue line
* PIT-PO: Red line
* **X-axis (all charts):**
* Label: Time (hours)
* Scale: 0 to 6 hours, with tick marks at every 2 hours.
* **Y-axis (all charts):**
* Label: NMSE (log scale)
* Scale varies for each chart, but is always logarithmic.
### Detailed Analysis
**Chart 1: Oscillation 1**
* Y-axis scale: 10^-18 to 10^-3
* **LLM-SR (Blue):** The line starts at approximately 10^-3 and remains relatively constant around 10^-6 throughout the entire time range.
* **PIT-PO (Red):** The line starts around 10^-6 and decreases stepwise to approximately 10^-18 by 4 hours, then remains constant.
* At t=0, NMSE is approximately 10^-6
* At t=1, NMSE is approximately 10^-9
* At t=2, NMSE is approximately 10^-12
* At t=4, NMSE is approximately 10^-18
**Chart 2: Oscillation 2**
* Y-axis scale: 10^-8 to 10^-2
* **LLM-SR (Blue):** The line starts at approximately 10^-2 and decreases stepwise to approximately 10^-6 by 6 hours.
* At t=0, NMSE is approximately 10^-2
* At t=2, NMSE is approximately 10^-3
* At t=4, NMSE is approximately 10^-4
* At t=6, NMSE is approximately 10^-6
* **PIT-PO (Red):** The line starts at approximately 10^-3 and decreases stepwise to approximately 10^-8 by 6 hours.
* At t=0, NMSE is approximately 10^-3
* At t=2, NMSE is approximately 10^-4
* At t=4, NMSE is approximately 10^-6
* At t=6, NMSE is approximately 10^-8
**Chart 3: E. coli Growth**
* Y-axis scale: 10^-2 to 10^0
* **LLM-SR (Blue):** The line starts at approximately 10^0 and decreases stepwise to approximately 10^-1 by 2 hours, then remains constant.
* At t=0, NMSE is approximately 10^0
* At t=2, NMSE is approximately 10^-1
* At t=6, NMSE is approximately 10^-1
* **PIT-PO (Red):** The line starts at approximately 10^-1 and decreases stepwise to approximately 10^-2 by 4 hours, then remains constant.
* At t=0, NMSE is approximately 10^-1
* At t=2, NMSE is approximately 10^-1
* At t=4, NMSE is approximately 10^-2
* At t=6, NMSE is approximately 10^-2
**Chart 4: Stress-Strain**
* Y-axis scale: 10^-2 to 10^0
* **LLM-SR (Blue):** The line starts at approximately 10^0 and decreases stepwise to approximately 10^-1 by 4 hours, then remains constant.
* At t=0, NMSE is approximately 10^0
* At t=2, NMSE is approximately 10^-1
* At t=4, NMSE is approximately 10^-1
* At t=6, NMSE is approximately 10^-1
* **PIT-PO (Red):** The line starts at approximately 10^-1 and decreases stepwise to approximately 10^-2 by 2 hours, then remains constant.
* At t=0, NMSE is approximately 10^-1
* At t=2, NMSE is approximately 10^-2
* At t=6, NMSE is approximately 10^-2
### Key Observations
* In "Oscillation 1", PIT-PO achieves significantly lower NMSE values than LLM-SR, indicating superior performance.
* In "Oscillation 2", both methods start with similar NMSE, but PIT-PO reaches a lower NMSE value by the end of the time period.
* In "E. coli Growth" and "Stress-Strain", PIT-PO generally achieves lower NMSE values than LLM-SR.
* The shaded regions around the lines indicate the variability or uncertainty associated with each method's performance.
### Interpretation
The charts compare the performance of two methods, LLM-SR and PIT-PO, across four different tasks. The NMSE (Normalized Mean Squared Error) is used as a metric to evaluate the performance, with lower values indicating better performance.
The data suggests that PIT-PO generally outperforms LLM-SR in these tasks, especially in "Oscillation 1" where the difference in NMSE is substantial. In "Oscillation 2", PIT-PO shows a slight advantage over LLM-SR. For "E. coli Growth" and "Stress-Strain", PIT-PO also demonstrates better performance, although the difference is less pronounced than in "Oscillation 1".
The stepwise decrease in NMSE for PIT-PO in "Oscillation 1" suggests that the method converges to a solution more efficiently than LLM-SR. The shaded regions around the lines indicate the variability in the performance of each method, which should be considered when interpreting the results.