## LineGraphs: NMSE Comparison of LLM-SR and PIT-PO Across Scenarios
### Overview
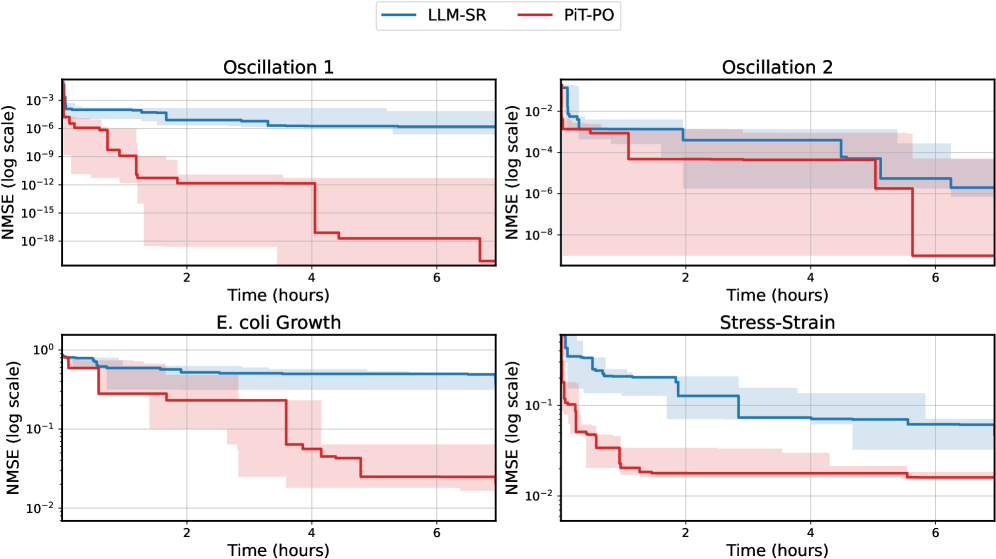
The image contains four line graphs comparing the performance of two methods, **LLM-SR** (blue) and **PIT-PO** (red), across four scenarios: **Oscillation 1**, **Oscillation 2**, **E. coli Growth**, and **Stress-Strain**. Each graph plots **Normalized Mean Squared Error (NMSE)** on a logarithmic scale against **Time (hours)**. Shaded regions around the lines represent confidence intervals (e.g., ±1σ or ±2σ).
---
### Components/Axes
- **X-axis**: Time (hours), ranging from 0 to 6 hours in all graphs.
- **Y-axis**: NMSE (log scale), spanning from 10⁻³ to 10⁻¹⁸ (Oscillation 1), 10⁻² to 10⁻⁸ (Oscillation 2), 10⁻¹ to 10⁻² (E. coli Growth), and 10⁻¹ to 10⁻² (Stress-Strain).
- **Legend**: Located in the top-right corner of the entire figure.
- **Blue**: LLM-SR
- **Red**: PIT-PO
- **Shading**:
- Blue shading for LLM-SR confidence intervals.
- Red shading for PIT-PO confidence intervals.
---
### Detailed Analysis
#### Oscillation 1
- **LLM-SR (Blue)**:
- Starts at ~10⁻³ NMSE at 0 hours.
- Drops stepwise to ~10⁻⁶ at 2 hours, ~10⁻¹² at 4 hours, and ~10⁻¹⁸ by 6 hours.
- Confidence interval narrows significantly over time.
- **PIT-PO (Red)**:
- Begins at ~10⁻⁶ NMSE, remaining relatively flat until 4 hours (~10⁻⁹).
- Sharp drop to ~10⁻¹⁵ at 6 hours.
- Confidence interval remains wide throughout.
#### Oscillation 2
- **LLM-SR (Blue)**:
- Starts at ~10⁻² NMSE, drops to ~10⁻⁴ at 2 hours, ~10⁻⁶ at 4 hours, and ~10⁻⁸ by 6 hours.
- Confidence interval tightens progressively.
- **PIT-PO (Red)**:
- Begins at ~10⁻⁴ NMSE, remains stable until 4 hours (~10⁻⁶).
- Sharp decline to ~10⁻⁸ at 6 hours.
- Confidence interval widens slightly after 4 hours.
#### E. coli Growth
- **LLM-SR (Blue)**:
- Starts at ~10⁻¹ NMSE, drops to ~10⁻² at 2 hours, ~10⁻³ at 4 hours, and ~10⁻⁴ by 6 hours.
- Confidence interval narrows steadily.
- **PIT-PO (Red)**:
- Begins at ~10⁻² NMSE, remains flat until 4 hours (~10⁻³).
- Sharp drop to ~10⁻⁴ at 6 hours.
- Confidence interval widens after 4 hours.
#### Stress-Strain
- **LLM-SR (Blue)**:
- Starts at ~10⁻¹ NMSE, drops to ~10⁻² at 2 hours, ~10⁻³ at 4 hours, and ~10⁻⁴ by 6 hours.
- Confidence interval tightens over time.
- **PIT-PO (Red)**:
- Begins at ~10⁻² NMSE, remains stable until 4 hours (~10⁻³).
- Sharp decline to ~10⁻⁴ at 6 hours.
- Confidence interval widens after 4 hours.
---
### Key Observations
1. **LLM-SR consistently outperforms PIT-PO** across all scenarios, achieving lower NMSE values.
2. **Stepwise drops** in NMSE for LLM-SR suggest adaptive adjustments to dynamic conditions (e.g., oscillations, stress events).
3. **PIT-PO shows delayed improvement**, with significant NMSE reductions only after 4–6 hours.
4. **Confidence intervals** for LLM-SR are narrower, indicating more reliable predictions compared to PIT-PO.
---
### Interpretation
- **Performance Implications**: LLM-SR’s lower NMSE and tighter confidence intervals suggest superior predictive accuracy and stability under varying conditions (oscillations, biological growth, mechanical stress).
- **Temporal Dynamics**: The stepwise NMSE reductions in LLM-SR may reflect event-driven model updates (e.g., detecting oscillations or stress thresholds), while PIT-PO’s delayed response hints at slower adaptation.
- **Robustness**: LLM-SR’s narrower confidence intervals imply better generalization, whereas PIT-PO’s wider intervals indicate higher uncertainty in predictions.
- **Scenario-Specific Behavior**:
- In **Oscillation 1/2**, LLM-SR’s rapid NMSE drops align with periodic event detection.
- In **E. coli Growth** and **Stress-Strain**, LLM-SR’s gradual improvements suggest effective handling of nonlinear dynamics.
This analysis underscores LLM-SR’s advantages in dynamic, real-time prediction tasks, while PIT-PO may require optimization for scenarios demanding rapid adaptation.