## Bar Chart: Model Accuracy Comparison (Generation vs. Multiple-choice)
### Overview
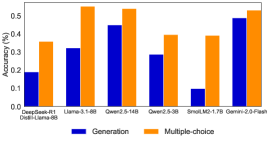
The image is a vertical bar chart comparing the accuracy (in percentage) of various language models on two distinct task types: "Generation" and "Multiple-choice". The chart uses a dual-bar format for each model, with blue bars representing Generation accuracy and orange bars representing Multiple-choice accuracy.
### Components/Axes
* **Chart Title:** "Accuracy (%)" (positioned at the top-left of the chart area).
* **Y-Axis:** Labeled "Accuracy (%)". The scale runs from 0 to 60, with major tick marks at intervals of 10 (0, 10, 20, 30, 40, 50, 60).
* **X-Axis:** Lists six distinct model names or categories. From left to right:
1. `Qwen2-0.5B`
2. `Llama-3-8B`
3. `Qwen2-14B`
4. `Qwen2-72B`
5. `Small-1.7B-70B` (Note: This label appears to be a composite or specific variant name).
6. `Qwen2-7B-Chat`
* **Legend:** Positioned at the bottom center of the chart. It contains two entries:
* A blue square labeled "Generation".
* An orange square labeled "Multiple-choice".
### Detailed Analysis
The following data points are approximate values extracted by visually aligning the top of each bar with the y-axis scale.
| Model Name | Generation Accuracy (Blue Bar) | Multiple-choice Accuracy (Orange Bar) |
| :--- | :--- | :--- |
| **Qwen2-0.5B** | ~20% | ~35% |
| **Llama-3-8B** | ~35% | ~55% |
| **Qwen2-14B** | ~45% | ~55% |
| **Qwen2-72B** | ~30% | ~40% |
| **Small-1.7B-70B** | ~5% | ~40% |
| **Qwen2-7B-Chat** | ~50% | ~55% |
**Visual Trend Verification:**
* **Generation (Blue Bars):** The trend is non-linear. Accuracy starts low (~20%), rises to a peak at `Qwen2-14B` (~45%), then dips significantly for `Qwen2-72B` (~30%) and plummets for `Small-1.7B-70B` (~5%), before rising sharply again to its highest point at `Qwen2-7B-Chat` (~50%).
* **Multiple-choice (Orange Bars):** The trend is more consistently high. It starts at ~35%, jumps to ~55% for `Llama-3-8B` and `Qwen2-14B`, dips to ~40% for `Qwen2-72B` and `Small-1.7B-70B`, and returns to ~55% for `Qwen2-7B-Chat`.
### Key Observations
1. **Consistent Performance Gap:** For every single model listed, the accuracy on Multiple-choice tasks (orange) is higher than on Generation tasks (blue). The gap is smallest for `Qwen2-7B-Chat` (~5 percentage points) and largest for `Small-1.7B-70B` (~35 percentage points).
2. **Highest and Lowest Performers:**
* The highest accuracy for **Generation** is achieved by `Qwen2-7B-Chat` (~50%).
* The highest accuracy for **Multiple-choice** is shared by `Llama-3-8B`, `Qwen2-14B`, and `Qwen2-7B-Chat` (all ~55%).
* The lowest accuracy for **Generation** is by `Small-1.7B-70B` (~5%).
* The lowest accuracy for **Multiple-choice** is by `Qwen2-0.5B` (~35%).
3. **Notable Anomaly:** The model labeled `Small-1.7B-70B` shows a dramatic disparity. It has the worst performance on Generation tasks by a large margin but performs moderately well on Multiple-choice tasks (~40%), comparable to the much larger `Qwen2-72B` model on the same task.
### Interpretation
This chart demonstrates a clear and consistent trend: the evaluated language models find "Multiple-choice" tasks significantly easier than "Generation" tasks. This is expected, as multiple-choice questions provide a constrained answer space and test recognition/recall, while generation requires open-ended synthesis and production of novel text.
The data suggests that model size (as implied by names like 0.5B, 8B, 14B, 72B) is not the sole determinant of performance, especially on generation tasks. For instance, `Qwen2-7B-Chat` outperforms the much larger `Qwen2-72B` on generation. This highlights the importance of model architecture, training data, and fine-tuning (as suggested by the "-Chat" suffix) for specific task types.
The outlier `Small-1.7B-70B` is particularly interesting. Its name is ambiguous, but its performance profile—catastrophic on generation, decent on multiple-choice—could indicate a model heavily optimized or specialized for discriminative tasks, or perhaps a model that has undergone a form of distillation or pruning that severely impacted its generative capabilities while preserving its ability to select correct answers from a list. This chart effectively visualizes the fundamental difference in difficulty between these two core NLP task paradigms across a range of model architectures.